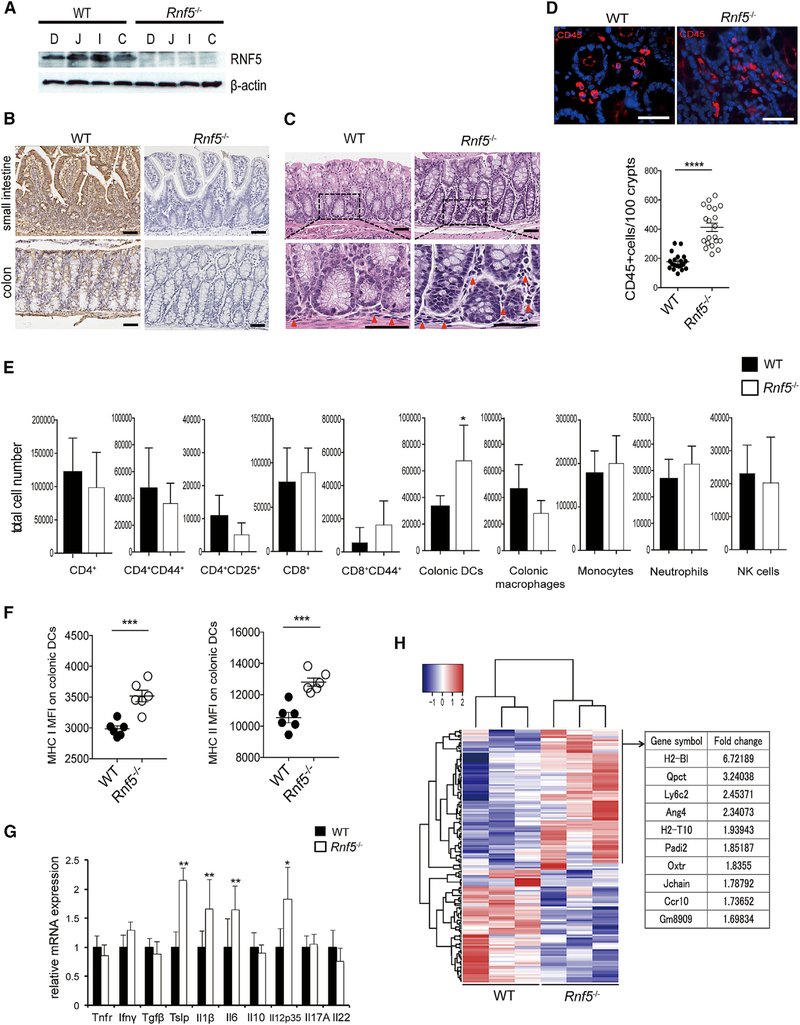
Figure 1. RNF5 Is Crucial for the Maintenance of Intestinal Homeostasis.
(A) Representative immunoblot of RNF5 in IECs from different intestinal regions of WT and Rnf5−/− mice: duodenum (D), jejunum (J), ileum (I), and colon (C).
(B) Representative IHC staining of RNF5 in small intestine and colon sections of WT and Rnf5−/− mice. Scale bars, 50 μm.
(C) Representative H&E staining of WT and Rnf5−/− colon sections (red triangles indicate infiltrating lymphocytes). Scale bars, 50 μm.
(D) Representative images of immunofluorescence staining of CD45 in WT and Rnf5−/− colon sections and quantification of CD45+ cells (n = 10, two fields each). Scale bars, 50 μm.
(E) Flow cytometric analysis of the frequencies of CD4+, CD4+CD44+, CD4+CD25+, CD8+, and CD8+CD44+ T cells, colonic DCs (CD45+ CD11c+ CD103+ F4/80-), colonic macrophages (CD45+ CD11c+ CD103- F4/80+), inflammatory monocytes (CD45+ CD11c- Ly6C+), neutrophils (CD45+ CD11c- Ly6G+), and NK1.1+ NK cells among gated CD45+ cells isolated from the lamina propria of colons from WT and Rnf5−/− mice (n = 6).
(F) (F) Mean fluorescence intensity (MFI) of MHC classes I and II on colonic DCs cells isolated from the lamina propria of colons from WT and Rnf5−/− mice (n = 6). (G) qRT-PCR analysis of elative mRNA expression of the indicated cytokines in WT and Rnf5−/− colon tissues (n = 6).
(G) (H) Heatmap analysis of RNA-seq data performed from three naive WT or Rnf5−/− colon tissues per group (left). One hundred fifty-six significantly dysregulated genes were identified in Rnf5−/− colon tissues compared with naive Rnf5−/− colon tissues (false discovery rate [FDR] adjusted p value < 0.05 by Benjamini-Hochberg method). Right table shows the top 10 upregulated genes identified in Rnf5−/− colon tissues.
(H) All data are representative of three independent experiments. Graphs show mean ± SEM. *p < 0.05, **p < 0.01, ***p < 0.001, and ****p < 0.0001 by two-tailed t test (D–G).

