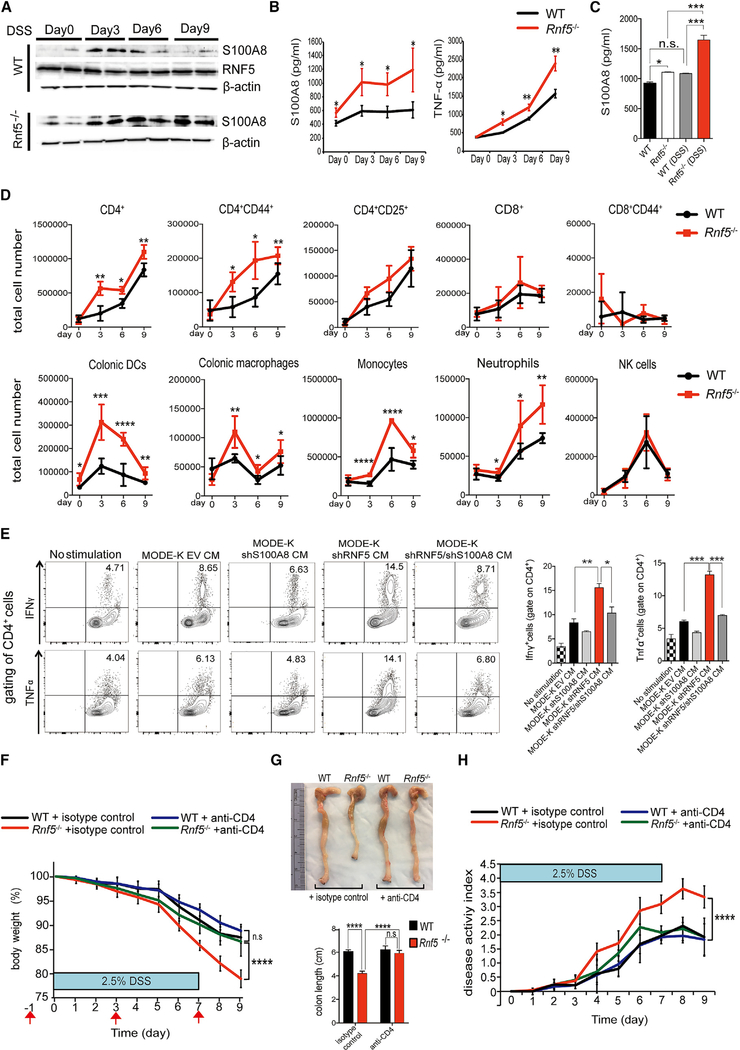
Figure 5. RNF5 Regulates the Development of DSS-Induced Colitis through S100A8-Mediated CD4+ T Cell Activation.
(A) Representative immunoblots of S100A8 and RNF5 in protein extracts of the distal colon from WT and Rnf5−/− mice on the indicated days after DSS administration.
(B) ELISA quantification of S100A8 and TNF-α in the culture supernatants after 24 hr incubation of distal colonic explants isolated from WT and Rnf5−/− mice on the indicated days after DSS administration (n = 3 mice/group).
(C) ELISA quantification of S100A8 levels in the serum from WT and Rnf5−/− mice isolated on day 0 and day 9 after DSS administration (n = 4/group).
(D) Flow cytometric analysis of the frequencies of CD4+, CD4+CD25+, CD4+CD44+, CD8+, and CD8+CD44+ T cells, colonic DCs, colonic macrophages, neutrophils, monocytes, and NK cells in gated CD45+ cells isolated from the lamina propria of colons from WT and Rnf5−/− mice on the indicated days after DSS administration (n = 3–6 mice/group).
(E) Intracellular IFN-γ and TNF-α staining of the CD4+ T cells from LCMV-specific TCR transgenic SMARTA mice. BMDCs were generated from WT mice and incubated for 18 hr with conditioned medium (CM) derived from MODE-K cells expressing EV, shS100A8, shRNF5, or shRNF5 plus shS100A8 treated with 0.5% DSS for 24 hr. BMDCs were then incubated for 72 hr with CFSE-labeled SMARTA CD4+ T cells (shown in Figure S5H) in the presence of 2 μg/mL GP61–80 peptide. Right plot shows quantification of intracellular IFN-γ+ and TNF-α+ CD4+ T cells (n = 3 wells/condition).
(F) Body weight of WT and Rnf5−/− mice administered 2.5% DSS and treated with control rat IgG2b or anti-CD4 neutralizing antibody (200 μg, intraperitoneal [i.p.]) on days –1, 3, and 7, relative to the start of DSS treatment on day 0 (n = 8 mice/group), as shown by red arrows (on day 9: ****p < 0.0001; Rnf5−/− +isotype control versus Rnf5−/− +anti-CD4, ****p < 0.0001; WT + isotype control versus Rnf5−/− + isotype control, n.s.; WT + anti-CD4 versus Rnf5−/− + anti-CD4).
(G) Representative images (top) of colon and cecum and quantification (bottom) of colon length from anti-CD4- or isotype control-treated WT or Rnf5−/− mice as described for (F) on day 9 after 2.5% DSS treatment (n = 8).
(H) Disease activity index (see STAR Methods) of anti-CD4- or isotype control-treated WT or Rnf5/ mice after 2.5% DSS treatment as described for (F) (n = 8) (on day 9: ****p < 0.0001; Rnf5−/− isotype control versus Rnf5−/− + anti-CD4, ****p < 0.0001; WT + isotype control versus Rnf5−/− +isotype control, n.s.; WT + anti-CD4 versus Rnf5−/− + anti-CD4).
All data are representative of two or three independent experiments. Graphs show mean ± SEM. *p < 0.05, **p < 0.01, ***p < 0.001, and ****p < 0.0001 by two-tailed t test (B and D). *p < 0.01, **p < 0.001, and ***p < 0.0001 by one-way ANOVA followed by Tukey’s multiple comparison test (C and E). ****p < 0.0001 by two-way ANOVA followed by Tukey’s multiple comparison test (F–H).

