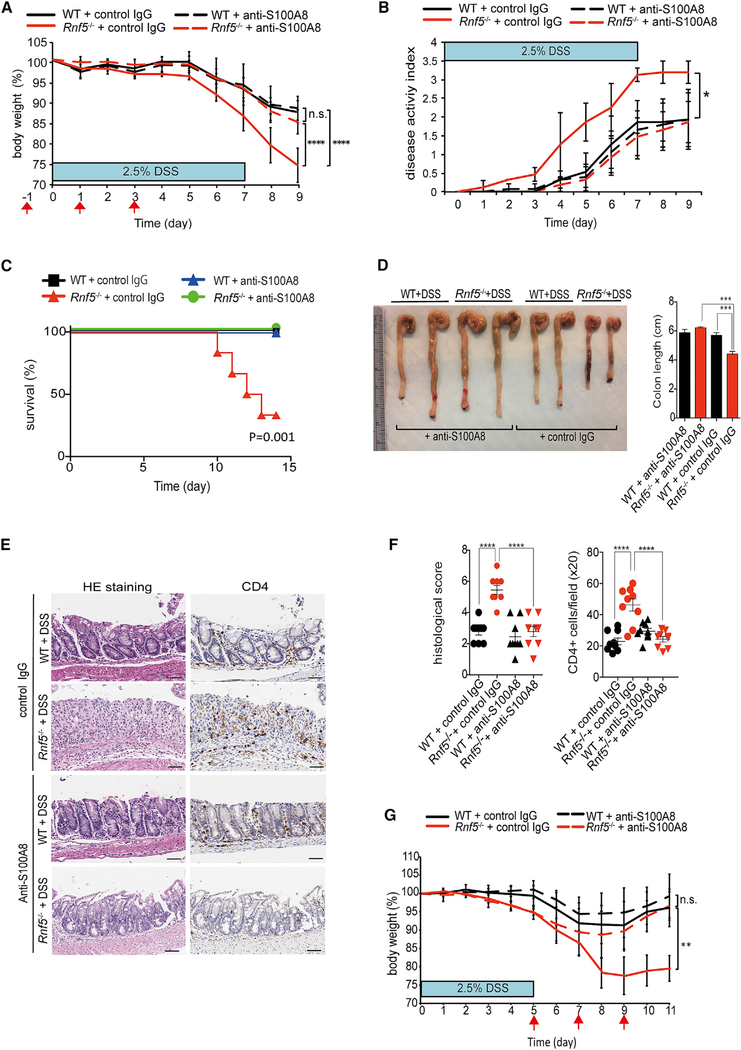
Figure 6. Neutralizing Antibodies to S100A8 Attenuate Acute Colitis in DSS-Treated Rnf5−/− Mice.
(A) Body weight of WT and Rnf5−/− mice administered 2.5% DSS and treated with control rabbit IgG or rabbit anti-S100A8-neutralizing antibody (200 μg, i.p.) on days –1, 1, and 3, relative to the start of DSS treatment on day 0 (n = 6 mice/group), as shown by red arrows (on day 9: ****p < 0.0001; Rnf5−/− + control IgG versus Rnf5−/− + anti-S100A8, ****p < 0.0001; WT + control IgG versus Rnf5−/− +control IgG, n.s.; WT + anti-S100A8 versus Rnf5−/− +anti-S100A8).
(B) Disease activity index (see STAR Methods) of anti-S100A8- or control rabbit IgG-treated WT or Rnf5−/− mice after 2.5% DSS treatment as described for (A) (n = 5) (on day 9: *p < 0.05; Rnf5−/− + control IgG versus Rnf5−/− + anti-S100A8, *p < 0.05; WT + control IgG versus Rnf5−/− +control IgG, n.s.; WT + anti-S100A8 versus Rnf5−/− + anti-S100A8).
(C) Survival of anti-S100A8- or control IgG-treated WT and Rnf5−/− mice after 2.5% DSS treatment (n = 6 mice/group) by Kaplan-Meier method.
(D) Representative images (left) of colon and cecum and quantification (right) of colon length from anti-S100A8- or control rabbit IgG-treated WT or Rnf5−/− mice as described for (A) on day 9 after 2.5% DSS treatment (n = 5).
(E) Representative images of H&E-stained and anti-CD4-stained colon sections from WT and Rnf5−/− mice treated as described for (A). Sections are from mice sacrificed on day 9. Scale bars, 50 μm.
(F) Quantification of histological score and CD4+ cells (per 203 field) from WT and Rnf5−/− mice treated with anti-S100A8 antibody or control rabbit IgG after 2.5% DSS treatment for (E) (n = 3 mice/group, three fields each).
(G) Body weight of WT and Rnf5−/− mice administered 2.5% DSS for 5 days and treated with control rabbit IgG or rabbit anti-S100A8-neutralizing antibody (200 μg, i.p.) on days 5, 7, and 9 (n = 6 mice/group), as shown by red arrows (on day 9: **p < 0.01; Rnf5−/− + control IgG versus Rnf5−/− + anti-S100A8, **p < 0.01; WT + control IgG versus Rnf5−/− +control IgG, n.s.; WT + anti-S100A8 versus Rnf5−/− +anti-S100A8).
All data are representative of two or three independent experiments. Graphs show mean ± SEM. *p < 0.05, **p < 0.01, ***p < 0.001, and ****p < 0.0001 by two-way ANOVA followed by Tukey’s multiple comparison test (A, B, and G) or one-way ANOVA (D, F). Survival by log rank test (C).

