

Abstract
The transactivator of transcription protein, HIV-1 Tat, is linked to neuroAIDS, where degeneration of dopamine neurons occurs. Using a mouse model expressing GFAP-driven Tat protein under doxycycline (Dox) regulation, we investigated microglial-neuronal interactions in the rostral substantia nigra pars compacta (SNc). Immunohistochemistry for microglia and tyrosine hydroxylase (TH) showed that the ratio of microglia to dopamine neurons is smaller in the SNc than in the ventral tegmental area (VTA) and that this difference is maintained following 7-day Dox exposure in wild type animals. Administration of Dox to wild types had no effect on microglial densities. In addressing the sensitivity of neurons to potentially adverse effects of HIV-1 Tat, we found that HIV-1 Tat exposure in vivo selectively decreased TH immunoreactivity in the SNc but not in the VTA, while levels of TH mRNA in the SNc remained unchanged. HIV-1 Tat induction in vivo did not alter the total number of neurons in these brain regions. Application of Tat (5 ng) into dopamine neurons with whole-cell patch pipette decreased spontaneous firing activity. Tat induction also produced a decline in microglial cell numbers, but no microglial activation. Thus, disappearance of dopaminergic phenotype is due to a loss of TH immunoreactivity rather than to neuronal death, which would have triggered microglial activation. We conclude that adverse effects of HIV-1 Tat produce a hypodopamine state by decreasing TH immunoreactivity and firing activity of dopamine neurons. Reduced microglial numbers after Tat exposure in vivo suggest impaired microglial functions and altered bidirectional interactions between dopamine neurons and microglia.
Keywords: neuroAIDS, microglia, dopamine neurons, HIV-1 Tat, microglia-neuron interactions
Graphical Abstract
Introduction
NeuroAIDS represents a complex syndrome of neurological dysfunction characterized by cognitive impairments resulting in HIV-1 associated dementia (HAD) and mood disorders, as well as motor deficits, a scenario that persists even in the presence of antiretroviral drug therapy (Simioni et al., 2010; Valcour et al., 2008). Epidemiological studies suggest that drug abuse may be a contributing factor in the progression of neuroAIDS (Bell et al., 1998; Burdo et al., 2006). Mechanistically, dopamine dysregulation is believed to play a role in neuroAIDS (Koutsilieri et al., 2002; Purohit et al., 2011), since neuronal cell loss in the human substantia nigra has been reported and is thought to be the result of neuronal degeneration there (Itoh et al., 2000; Reyes et al., 1991). Furthermore, degeneration of dopaminergic cells is believed to cause a dopamine deficit that may exacerbate severity of the neurological symptoms comprising HAND/HAD (Kumar et al., 2009; Purohit et al., 2011). Against this background we hypothesized that the viral protein, Tat, which is thought to be neurotoxic (Fatima et al., 2017), would exert adverse effects on dopaminergic neurons.
Anatomical studies have identified three clusters of dopaminergic neurons: the substantia nigra pars compacta (SNc) (A9), the ventral tegmental area (VTA) (A10), and a third smaller cluster, found in the retrorubral area (A8) (Bjorklund and Dunnett, 2007; Fu et al., 2012; Nestler, 2009; Zaborszky and Vadasz, 2001). Despite resembling each other in many respects, dopamine neurons of the SNc and VTA mediate distinct neurological functions and exhibit dissimilar responses to toxins and addictive agents (Choi et al., 2015; Macdonald and Monchi, 2011; Teo et al., 2004). Since the discovery of dopamine as a neurotransmitter (Carlsson et al., 1962) and the observation that it is depleted significantly in the SNc of patients with Parkinson’s disease (Benazzouz et al., 2014; Hornykiewicz and Kish, 1987; Tremblay et al., 2015), the regionally selective vulnerability of dopamine neurons has been the focus of a large number of studies (Bernheimer et al., 1973; Braak and Braak, 1986; Braak et al., 2003; Burns et al., 1983; Damier et al., 1999; Double et al., 2010; Fearnley and Lees, 1991; German et al., 1992; Gibb and Lees, 1991; Greenfield and Bosanquet, 1953; Halliday and Tork, 1986; Hirsch et al., 1989; Poulin et al., 2014).
Microglia, which express D1 and D2 dopamine receptors (Farber et al., 2005), have long been recognized as the primary and predominant CNS cell type to be productively infected by HIV-1 (Dickson et al., 1993; Garden, 2002; Michaels et al., 1988), and they are therefore of particular interest in terms of their mechanistic involvement with regard to dopamine dysregulation in the context of neuroAIDS. The primary purpose of the current study was to launch an in vivo investigation of possible interactions occurring between microglia and dopamine neurons, specifically in the context of HIV-1 infection. To this end, we have utilized the GT-tg bigenic mouse, a transgenic model that expresses GFAP-driven Tat protein under Dox regulation in the CNS (Kim et al., 2003; Paris et al., 2015).
Generally speaking, the interactions between microglia and CNS neurons are of significant research interest from a number of different perspectives under both normal and pathological conditions (Bruce-Keller, 1999; Eyo and Wu, 2013; Morgan et al., 2012; Pannell et al., 2014; Tsuda et al., 2013). Some ramified, non-activated microglia present throughout the normal CNS can be observed making close contacts with all types of neurons, suggesting that molecular exchanges, e.g. delivery of neurotrophins or synaptic remodeling, occur constitutively between them. Physical contacts and molecular interactions between microglia and neurons are intensified when damaged neurons trigger microglial activation (Streit et al., 1999; Virgone-Carlotta et al., 2013). Such microglial activation represents the first phase of a neuroinflammatory response to injury and as such its purpose is to facilitate neuronal recovery/regeneration, which occurs most conspicuously in neurons giving rise to peripheral nerves, and to a lesser extent in neurons whose axons are contained entirely within the CNS (Streit, 1993; Streit et al., 2000). We therefore view microglia primarily as neuron-supporting and neuroprotective cells (Streit, 2002).
Microglial interactions with dopamine neurons are largely unexplored but of great interest given the apparent susceptibility of these neurons to neurodegeneration, notably in the context of Parkinson’s disease, but also with regard to other disorders such as addiction, schizophrenia, and attention deficit hyperactivity disorder and, of course, neuroAIDS (Barcia et al., 2012; Barcia et al., 2004; Barker et al., 2016; Dalley et al., 2005; Hernandez et al., 2005; Hosp et al., 2011; Kwak et al., 2012; Kwak et al., 2010; Molina-Luna et al., 2009; Navratilova et al., 2016; Nestler, 2009). Using the traditional biomarker tyrosine hydroxylase (TH, the rate-limiting enzyme for dopamine synthesis), we examined the ratio of microglia and dopamine neurons in the VTA and SNc before and after exposure to HIV-1 Tat, and then asked whether there is a correlation between this ratio in the SNc vs. VTA and the differential sensitivity of these two neuronal populations to potentially adverse effects of HIV-1 Tat protein. Our data support the interpretation that interactions of microglia with dopaminergic neurons are an important link connecting dopaminergic dysfunction and NeuroHIV. These interactions could occur through direct effects of HIV-Tat on dopamine neurons or on microglia, as well as through indirect effects resulting from dopaminergic influence on microglial cell function or vice versa.
Methods and Materials
Animals and Housing
Adult male GT-tg bigenic mice, RFP::TH mice (Lin et al., 2016; Richardson et al., 2016; Saha et al., 2014; Sambo et al., 2017), and C57BL/6J wild-type (Jackson Labs, Bar Harbor, ME) mice (8–10 weeks of age) were maintained in the University of Florida animal facilities. All experiments were approved by the Institutional Animal Care and Use Committee. Creation of the GT-tg bigenic mice and genotype confirmation of the inducible and brain-targeted HIV-1 Tat protein was described previously (Kim et al., 2003; Paris et al., 2014).
Chemicals and reagents
All chemicals and reagents were obtained from Sigma-Aldrich (St Louis, MO). Doxycycline was dissolved in 0.9% saline before injection. Recombinant HIV-1 Tat protein (Tat1-86) was obtained from NIH AIDS Reagent Program.
Induction of brain-targeted Tat with doxycycline treatment
To express Tat1-86, GT-tg bigenic mice were administered doxycycline via intraperitoneal injections with a single daily dose of 100 mg/kg dissolved in 0.9% saline in a volume of 0.3 ml/30 g body weight for 7 days (GT-Dox), as indicated and characterized previously (Paris et al., 2014). Brains were harvested 7 days after Dox, or saline injections. GT-tg mice administered saline and C57BL/6J mice administered saline or doxycycline served as isogenic and congenic, negative controls, respectively.
Tissue specimen for quantitative image analysis
Animals deeply anesthetized with isoflurane underwent transcardial perfusion with phosphate buffered saline (PBS, pH 7.4) followed by freshly made 4% paraformaldehyde (PFA) in PBS. Brains were immersion-fixed in 4% PFA for an additional 24–48 hours. Brains were sectioned at 40 μm thickness with a vibratome. To ensure consistent comparisons only sections from similar coronal planes were used for quantitative image analysis (Fig. 1). Two methods of analysis were used in this study: 1) image analysis using z-plane showing the highest intensity of staining (see below), and 2) stereological analysis. These analyses were performed in two separate animal cohorts. Substantia nigra sections were taken at a rostral point since degeneration in SNc is known to start rostrally (Gibb and Lees, 1991). One section showing the full coronal orientation of SNc per animal was analyzed using quantitative image analysis described below. One rostral and one central section of the VTA per animal was analyzed using the same quantitative image analysis. Each half of a reference section (Fig. 1) was analyzed individually and used as a separate data set. In total, 4–5 animals per group were analyzed unless otherwise stated. For anatomical distinction between SNc and VTA the Allen mouse brain reference atlas (Lein et al., 2007) and the characterization of dopaminergic areas in the mouse brain by (Fu et al., 2012) were used.
Figure 1.

Schematics show coronal planes of the reference sections. Black and white images are shown in 4x magnification. (a) TH immunolabeling of a representative rostral section containing SNc and VTA in both hemispheres. (b) TH immunolabeling of a representative central section containing SNc and VTA in both hemispheres. (c) Control section taken rostrally and incubated with secondary antibody only. Scale bar: 500μm.
Immunohistochemistry for quantitative image analysis
Free floating sections were blocked with 10% normal goat serum (NGS) in 0.1% Triton X-100 in PBS while incubated for 1 hour at 37°C. Sections were then placed in primary antibody solution and kept at 4°C overnight. Sections were washed in PBS three times for 20 minutes each. The sections were incubated in secondary antibody solution at room temperature for 1 hour followed by an additional washing step. Sections were put on slides, air-dried and cover slipped with mounting medium (Fluoromount-G, Southern Biotech). Following addition of secondary antibody solution, sections were kept in the dark at all times. Antibodies were diluted with 5% NGS in 0.1 Triton X-100 in PBS. The description of antibodies and their dilutions are provided in Table 1.
Table 1.
Source and dilution of antibodies used in this study
| Primary antibody | Vendor | Dilution |
|---|---|---|
| Rabbit-anti-Iba1 | 019-19741, Wako | (1:800) |
| Mouse-anti-NeuN | MAB377, Millipore | (1:500) |
| Mouse-anti-TH, monoclonal (for TH/Iba1 co-labeling) | T1299, Sigma | (1:400) |
| Rabbit-anti-TH, polyclonal (for TH/NeuN co-labeling) | AB152, Millipore | (1:500) |
| Secondary Antibody | Vendor | Dilution |
| Goat-anti-rabbit, Alexa Fluor 568 | A11011, Invitrogen | (1:800) |
| Goat-anti-mouse, Alexa Fluor 488 | A11001, Life Technologies | (1:400) |
| Goat-anti-mouse, Alexa Fluor 488 | A11001, Life Technologies | (1:400) |
| Goat-anti-rabbit, Alexa Fluor 568 | A11011, Invitrogen | (1:500) |
Image acquisition and background correction
All images were taken with a Nikon A1 confocal imaging system. Image analysis was performed with NIS-Elements version 4.5. Rolling ball reduction (rolling ball = 50 pixels) was performed on all images to correct for uneven background staining.
Quantitative image analysis of TH positive (TH+) and Iba1 positive (Iba1+) cells
All steps of analysis were performed blind to the treatments. Images were taken with a 20x objective. 20x fields for SNc were taken laterally while VTA fields were taken medially to ensure a clear distinction between the two structures. All images were taken in the z-plane showing the highest intensity of TH staining ensuring a similar distance from the surface of the section. A region of interest (ROI) was defined surrounding dense areas of TH+ neurons. Cells inside the ROI were counted manually. Dopaminergic cells were counted only when there was a visible nucleus. Iba1-immunoreactive microglial cells were counted within the same ROI using double-immunofluorescent preparations. Cell counts were normalized to ROI area and density measured per 5000 μm2.
NeuN area staining quantification
40 μm thick stacks with 5 μm step size images were acquired. Image stacks were then merged into a “Maximum Intensity Projection”, projecting the brightest pixels throughout the stack into a single image. An ROI was defined by dense areas of TH+ neurons. The relative area of NeuN staining to the ROI size was measured by a custom pixel intensity thresholding macro in NIS-Elements Advanced Research analysis software to create a binary layer. A single intensity value determining the threshold was used for all images in each data set, adjusted when necessary.
Tissue specimen and immunohistochemistry for stereology
A separate cohort of animals was prepared for stereological assessment. Brains were fixed as described above. Coronal sections of the entire midbrain were collected at 40 μm intervals. Free floating sections were washed in PBS and incubated in blocking solution containing 0.3% Triton X-100 and 10% NGS in PBS for 1 hour at 37°C. Every other section of each brain was then incubated in primary antibody solutions containing rabbit anti-Iba1 (1:500); mouse anti-TH (1:400) or mouse anti-NeuN (1:500); rabbit anti-TH (1:500) overnight at 4°C. Next, sections were washed with PBS and incubated in secondary antibody solutions containing 0.3% Triton X-100 and 5% NGS and Alexa Fluor 568 and 488-conjugated secondary antibodies for 1 hour at room temperature in the dark. After washing with PBS, sections were mounted, coverslipped, and stored until analyzed.
Stereological analysis
Stereology analysis was performed to count total number of TH and NeuN positive neurons as well as Iba1 positive microglia in the VTA and SNc using optical fractionator method. Data collection was carried out using a Zeiss fluorescent microscope, equipped with the appropriate filter sets, a CCD camera, and StereoInvestigator software (MBF Bioscience, Williston, VT) which uses X-Y-Z motorized stages. The regions of interest were outlined at low power magnification (5X) from the entire rostral to caudal parts of VTA and SNc of one hemisphere. Total sections for each brain for quantification were 12. For each section, an approximately 10% tissue shrinkage in the z-plane was defined (the mean section thickness was measured at 36 μm). Immunolabeled cells were manually counted on a focal plane scanning with a 20X magnification in the z-axis. Sampling grade sizes and counting frames (80 μm X 80 μm) were optimized to attain a mean Gundersen coefficient of error (CE) less than 0.1 (Banuelos et al., 2013). TH positive neurons within VTA and SNc were identified as lightly stained cytoplasm surrounding an unstained nucleus. NeuN immunolabeled neurons were distinguished by stained nucleus containing a nucleolus in focus within the counting frame. Microglial cells were included in the counting if their Iba1+ cells were within the counting frame. The total number of cells was estimated by multiplying the sum of the cells counted by the reciprocal of the region that was sampled (i.e. the fraction of the histological sections examined, and the fraction of the total section thickness examined). Two first sections of each brain were considered as rostral parts of SNc and VTA.
Data analysis
All data were analyzed with Prism7 software. Shapiro-Wilk test was used to determine if the data is normally distributed. One-way ANOVA followed by post-hoc Tukey honest significant different (HSD) test was used for comparison. Differences in the data were considered significant if p < 0.05. All values are presented as percent of control (relative to wild-type saline) mean ± SEM.
Mouse brain schematics
Mouse brain schematics used in Figure 1 were taken from Allen Mouse Brain Atlas. © 2015 Allen Institute for Brain Science. Available from: http://mouse.brain-map.org (Lein et al., 2007).
Real-time, reverse transcriptase PCR
The SNc was dissected and homogenized in QIAzol Lysis Reagent (Qiagen®, Germantown, MD, USA). The homogenate was mixed with chloroform and centrifuged at 10,629 rpm for 15 minutes at 4°C in order to separate the RNA from DNA and lipids. The total RNA was purified using the RNeasy® Lipid Tissue Mini Kit (Qiagen®, Germantown, MD, USA) via the manufacturer’s instructions. The purified RNA was immediately quantified using a NanoDrop 2000 UV-Vis spectrophotometer (ThermoFisher Scientific, Waltham, MA, USA). If the ratio of absorbance at 260/230 nm was below 1.8 for the purified RNA, the RNA was precipitated overnight at −20°C in 3M sodium acetate, linear polyacrylamide (LPA, 5 μg/μL), and 100% ethanol to remove contaminants, centrifuged at 12,000 x g for 20 min at 4°C, and then quantified again using the NanoDrop 2000 UV-Vis spectrophotometer (ThermoFisher Scientific, Waltham, MA, USA). The RNA was converted to cDNA using the QuantiTect® Reverse Transcription Kit (Qiagen®, Germantown, MD, USA) via the manufacturer’s instructions. qPCR was performed using the TaqMan® Gene Expression Assay (ThermoFisher Scientific, Waltham, MA, USA) and the StepOneTM Real-Time PCR System (Thermofisher Scientific, Waltham, MA, USA). cDNA from three experimental groups (e.g., 11 wild type mice treated with 0.9% saline for 7 days, 6 wildt ype mice treated with doxycycline (100 mg/kg) dissolved in 0.9% saline, and 6 GT-tg bigenic mice treated with doxycycline (100 mg/kg) dissolved in 0.9% saline) were mixed with TaqMan® Gene Expression Assay primer sets for the genes, tyrosine hydroxylase (Th) and glyceraldehyde-3-phosphate dehydrogenase (Gapdh), which are listed in the below table, 2X TaqMan® Universal PCR Master Mix (Applied Biosystems, Foster City, CA, USA), and nuclease-free water. qPCR amplifications were performed in triplicate using the StepOneTM Real-Time PCR System (Thermofisher Scientific, Waltham, MA, USA) at 50°C for 2 min and 95°C for 10 min, which was followed by 40 cycles of 95°C for 15s and 60°C for 1 min. Gapdh was used as an internal control for normalization using the ΔΔCt method. The relative changes in Th gene expression was analyzed using the 2(−ΔΔCt)) method (Livak and Schmittgen, 2001) and subsequent one-way ANOVA and Tukey post hoc tests from the data acquired from the real-time quantitative PCR experiments. Differences in the data were considered significant if p < 0.05.
Functional evaluation of dopamine neurons in vitro
Midbrain neuronal cultures were obtained from RFP::TH mice, a transgenic mouse strain where the dopamine neurons are rendered fluorescent (Lin et al., 2016; Richardson et al., 2016; Saha et al., 2014; Sambo et al., 2017). Mouse midbrain dopamine neurons from 0–2 day old pups of either sex were isolated and incubated in a dissociation medium at 34–36°C under continuous oxygenation for 2 hours. Dissociated cells were pelleted by centrifugation at 500 x g for 10 min and resuspended in glial medium. Cells were plated on 12 mm round coverslips coated with 100 μg/ml poly-L-lysine and 5 μg/ml laminin in 35 x 10 mm tissue culture Petri dishes. Neuronal medium was conditioned overnight on cultured glia. The conditioned neuronal medium was supplemented with 1 ng/ml glial cell line-derived neurotrophic factor and 500 μM kynurenate and filter-sterilized before it was added to the neuronal cultures.
Whole-cell electrophysiological recordings
Spontaneous firing activity of midbrain dopamine neurons was examined via whole cell current clamp recordings. The neurons were continuously perfused with artificial cerebral spinal fluid (aCSF) containing (in mM): 126 NaCl, 2.5 KCl, 2 CaCl2, 26 NaHCO3, 1.25 NaH2PO4, 2 MgSO4, and 10 dextrose, equilibrated with 95% O2-5% CO2; pH was adjusted to 7.4. Patch electrodes were fabricated from borosilicate glass (1.5 mm outer diameter; World Precision Instruments, Sarasota, FL) with the P-2000 puller (Sutter Instruments, Novato, CA). The tip resistance was in the range of 3–5 MΩ. The electrodes were filled with a pipette solution containing (in mM): 120 potassium-gluconate, 20 KCl, 2 MgCl2, 10 HEPES, 0.1 EGTA, 2 ATP, and 0.25 GTP, with pH adjusted to 7.25 with KOH. Unless indicated, all experiments were performed in the presence of a dopamine D1 receptor antagonist SCH23390 (1 μM) and a D2 receptor antagonist sulpiride (1μM) (Lin et al., 2016; Saha et al., 2014; Sambo et al., 2017) in the aCSF to block dopamine D1 and D2 receptors. All experiments were performed at 37°C. To standardize action potential (AP) recordings, neurons were held at their resting membrane potential (see below) by DC application through the recording electrode. AP was recorded if the following criteria were met: a resting membrane potential of less than −35 mV and an AP peak amplitude of >60 mV. AP half-width was measured as the spike width at the half-maximal voltage using Clampfit 10 software (Axon instruments, Foster City, CA). Since AHP peaked at about 10 milliseconds (ms) from beginning of the AP, the AHP amplitudes were measured at 10 ms. The spontaneous spike activity of midbrain dopamine neurons was obtained by averaging 1 min interval activities.
Data analysis
The electrophysiology data was acquired using the ClampEx 10 software package (Axon Instruments, Foster City, CA). The data were analyzed offline using pClamp 10. For all experiments, the data are presented as mean ± SEM. n denotes the number of neurons for each experiment. Statistical significance was assessed using Student’s t test. Differences were considered significant at p < 0.05.
Results
In wild type animals, dopamine neurons in the SNc receive less microglial support than VTA dopamine neurons
Since microglial interactions with dopaminergic neurons are of particular interest given the susceptibility of some of these cells to neurodegeneration, we first examined the ratio of Iba1-positive microglia cells to the number of TH positive neurons. We found that the ratio of microglia to dopaminergic neurons was significantly lower in the SNc than in the VTA (p < 0.05, Fig. 2). This observation suggests that SNc dopamine neurons receive less microglial support than VTA dopamine neurons. Since induction of brain-targeted Tat in the GT-tg bigenic mice are controlled via doxycycline (Dox), next, we asked whether in wild type mice Dox alters the ratio of Iba1-positive microglia cells to the number of TH positive neurons. We found that administration of Dox for 7 days to wild type animals did not alter this ratio significantly in either the SNc or the VTA (Fig. 2).
Figure 2.

In wild type C57BL/6J mice, the ratio of microglia / TH+ neurons is smaller in the SNc than in the VTA. A 7-day doxycycline treatment does not alter this ratio. (a) Bar graph shows the ratio of microglia to TH+ neurons in the SNc and VTA of wild type mice treated with saline or doxycycline. Data is shown as mean ± SEM, n = 8–20 sections total from 4–5 animals, *p < 0.05, ****p < 0.0001. (b) 3-D view of 60x Z-stack double- immunolabeling for TH (green) and microglia (red) in the SNc and VTA. Graticule size: 20 μm.
Administration of doxycycline has no effect on microglial cell numbers
Since some studies have reported a decrease in microglial cell numbers following Dox administration (Sultan et al., 2013) we also assessed microglial density in wild type animals treated with either saline or Dox for 7 days. We found that Dox had no effect on microglial cell density or morphology in either location using Iba1 immunolabeling (p < 0.05, Fig. 3).
Figure 3.

Doxycycline does not alter Iba1 immunoreactivity in wild type C57BL/6J mice. (a) Bar graph shows microglial densities in the SNc and VTA of saline or doxycycline treated wild type mice. Data is shown as mean ± SEM, n = 8–20 sections total from 4–5 animals, p >0.05; (b) Representative Iba1 immunolabeling showing microglial morphology and density. Scale bar: 50 μm; (c) 3D reconstructions of 60x stacked images. Graticule size: 20μm
HIV-1 Tat causes a decrease in the number of TH-positive neurons in the SNc but not in the VTA
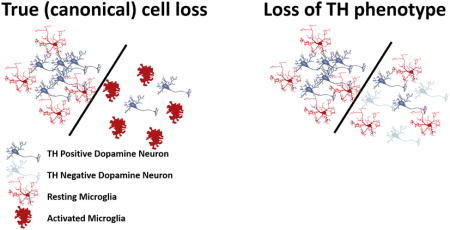
The unexpected finding of different ratios of microglia to dopaminergic neurons led us to test the hypothesis that SNc and VTA are differentially affected by HIV-1 Tat induction. HIV-1 Tat is thought to induce dopaminergic dysfunction or toxicity associated with neuroAIDS. Thus, we measured TH immunoreactivity in the SNc and VTA of GT-tg mice treated with either saline or Dox for 7 days. Our results show a significant decrease in TH immunoreactivity in the SNc (33% loss; p < 0.001) after 7 days of Dox administration relative to saline-treated GT-tg mice and to WT mice treated with either saline or Dox (Fig. 4a,c). There was no difference between TH immunoreactivity in WT-saline and WT-Dox groups in either brain regions (not shown). In contrast to the SNc, there was no measurable loss of TH-immunoreactivity in the VTA in any of the experimental groups (Fig. 4) supporting the idea that midbrain dopamine neuron populations exhibit differential susceptibilities to the adverse effects of HIV-1 Tat. While loss of TH immunoreactivity in the SNc suggested loss of dopaminergic neurons in the SNc, adjacent sections stained for NeuN antigen revealed no differences between the experimental groups (Fig. 5), thus pointing towards loss of TH phenotype rather than to a loss of neurons due to cell death.
Figure 4. HIV-1 Tat expression decreases TH immunoreactivity in the SNc but not VTA.

(a) Bar graph shows the density of TH+ neurons in the rostral SNc of wild type and GT-tg bigenic animals. Absolute counting values were put in relation to the measured area of the ROI. n = 8–20 sections from 4–5 animals. Data is shown as mean + SEM, *p < 0.05, **p < 0.01, ***p < 0.001, one-way ANOVA followed by post hoc Tukey HSD test, all groups relative to WT-Saline. (b) Similar to absolute counting values, stereological assessment of the SNc reveals significant reduction in TH immunoreactivity in GT-tg bigenic animals as compared to WT controls. SNc defined as the first two sections (40 μm thick slices, every other slice, representing the first 120 μm) of the SNc displaying TH immunoreactivity. n = 4–5 animals. (c,d) TH immunoreactivity in the VTA is unaffected by 7-day Tat induction in both counting (n = 8–20 sections from 4–5 animals per group) and stereological assessment (n = 4–5 animals per group). (e) Representative images of the SNc (top) and VTA (bottom) in WT-Saline, GT-Saline, and GT-Dox conditions. Note the significant reduction of TH+ SNc neurons in the GT-tg bigenic animals while TH immunoreactivity in the VTA remains unaffected. Scale bar is 200 μm.
Figure 5. HIV-1 Tat expression does not decrease NeuN immunoreactivity in the SNc or VTA.

For NeuN image analysis “Maximum Intensity Projection”, projecting the brightest pixels throughout the stack into a single image was analyzed. An ROI was defined by dense areas of TH+ neurons. The relative area of NeuN staining to the ROI size was measured by a custom pixel intensity thresholding macro in NIS-Elements Advanced Research analysis software to create a binary layer. There are no significant differences in NeuN immunoreactivity in the SNc or VTA across all experimental groups by both counting and stereological measurements. Data is shown as mean ± SEM, *p < 0.05, **p < 0.01, ***p < 0.001, one-way ANOVA followed by post hoc Tukey HSD test, all groups relative to WT-Saline. (a, c) NeuN labeling is defined as relative area occupied by immunoreactive staining in the ROI. In both SNc and VTA, NeuN immunoreactive area is unaffected by HIV-1 Tat expression. n = 8–20 sections from 4–5 animals per group. (b, d) There are no significant differences in the total number of NeuN immunoreactive cells in either the SNc or VTA. n = 4–5 animals per group. (e) Images show NeuN immunoreactivity in the SNc and VTA. Scale bar is 200 μm.
HIV-1 Tat-induced loss of TH phenotype is not accompanied by microglial activation
We reasoned that if the observed loss of TH phenotype in the SNc were due to neuronal cell death there would be a swift increase in microglial reactivity and morphology, and likely macrophage transformation, as we and others have shown that microglia respond to acute neurotoxicity in this manner (McCann et al., 1996; Streit and Kreutzberg, 1988). We carefully analyzed features of microglial morphology in the SNc of experimental and control groups. As shown in Fig. 6, none of the classic characteristics of microglial activation, such as cytoplasmic hypertrophy or cellular hyperplasia (proliferation), were found in the SNc of animals that received HIV-1 Tat induction. Thus, loss of TH phenotype did not elicit a measurable morphological change in microglia to indicate transformation from their normal ramified state to a state of activation. Instead, we found that HIV-1 Tat expression reduced the number of Iba1 immunoreactive cells in the SNc, suggesting that microglia were compromised in their function or were lost due to HIV-1 Tat induction. The simultaneous reductions in TH+ neurons and in microglia resulted in an unaltered ratio of microglia to TH+ neurons in the SNc. In the VTA, microglia maintained normal ramified morphology and numbers after HIV-1 Tat induction (Fig. 6), supporting the idea that these two brain regions are differentially affected by HIV-1 Tat. There was no difference between Iba1 immunoreactivity in WT-saline and WT-Dox groups in either brain region (not shown).
Figure 6. HIV-1 Tat expression reduces Iba1 immunoreactivity in the SNc but not VTA.

(a) Stereological assessment reveals a reduction in the number of Iba1 immunoreactive microglia in the SNc in response to HIV-1 Tat expression. n = 4–5 animals per group. (b) Iba1 immunoreactive microglial cell numbers in the VTA are not significantly affected by HIV-1 Tat expression. n = 4–5 animals per group. (c) Representative images of Iba1 immunolabeling in the SNc and VTA of WT saline, GT-Saline, and GT-Dox. Note the reduction in total number of Iba1 immunoreactive cells in the GT-Dox condition but absence of morphological changes in the microglia, or phagocytic clusters. Data is shown as mean ± SEM, *p < 0.05, **p < 0.01, ***p < 0.001, one-way ANOVA followed by post hoc Tukey HSD test, all groups relative to WT-Saline. Scale bar is 200 μm.
HIV-1 Tat does not change Th mRNA expression in the SNc
Since previous literature has suggested that HIV-1 Tat can inhibit the gene expression of TH (Zauli et al., 2000), we tested the hypothesis that HIV-1 Tat affects Th mRNA levels in the SNc. To address this hypothesis, we performed quantitative reverse transcription polymerase chain reaction (qRT-PCR) on the SNc derived from wild type mice treated daily for 7 days with 0.9% saline, wild type mice treated daily for 7 days with doxycycline (Dox, 100 mg/kg) in 0.9% saline, and GT-tg mice treated daily for 7 days with Dox (100 mg/kg) in 0.9% saline. We measured fold change in Th mRNA expression in the SNc of all experimental groups compared to that of wild type mice treated with 0.9% saline for 7 days. HIV-1 Tat induction with Dox in the GT-tg mice did not change expression of the Th gene as compared to wild type controls treated with saline. These results suggest that the loss of TH phenotype in the SNc occurs at the level of the protein as observed in Figure 4 instead of at the level of gene transcription.
HIV-1 Tat decreased spontaneous firing activity of dopamine neurons
To examine the direct effect of HIV-1 Tat on dopamine transmission we used single neuron recording when Tat (Tat1-86, 5 ng) was directly applied into the dopamine neuron via the whole-cell patch pipette (Fog et al., 2006; Gnegy et al., 2004). To ensure proper identification of dopamine neurons in our recordings we used multiple complementary approaches. The dopaminergic neurons were identified 1) by expression of tyrosine hydroxylase (TH) promoter-driven red fluorescent protein, 2) morphologically by their large cell bodies with broad 2–5 first order processes, 3) electrophysiologically by their well-characterized spontaneous firing frequency of 0.3–4 Hz as described previously (Richardson et al., 2016; Saha et al., 2014; Sambo et al., 2017). The average input resistance was 320.5 ± 22.5 MΩ; membrane time constant was 832.1 ± 46.7 μs; and membrane capacitance was 65.8 ± 3.3 pF.
Figure 8 shows a representative example of spontaneous spike activity before (D and E) and after application of HIV-1 Tat (5 ng) into the dopamine neuron (F and G). Consistent with previous studies (Grace and Bunney, 1984), the majority of the recorded dopamine neurons exhibited a mixture of single spikes and burst activity with an underlying “pacemaker-like” periodicity. Tonic irregular single-spike firing occurred at rates of 1–4 spikes per second; bursts of 3–8 spikes occurred at high frequencies of approximately 10–20 Hz with a pause between subsequent bursts. The resting potential was defined as the baseline voltage at spike threshold. Application of HIV-1 Tat into the neurons gradually reduced the spontaneous firing rate, which was determined from the mean baseline value set as 100% (Fig. 8, p < 0.05, Student’s t tests; n = 5–7). Since we performed these experiments in the presence of D1 and D2 receptors blockade in th bath solution, these data suggest that upon entry into the dopamine neurons, HIV-1 Tat can directly modulate neuronal activity leading to decreased dopamine transmission.
Fig 8. HIV-1 Tat decreases spontaneous firing activity of midbrain dopaminergic neurons.

(a) Representative image of TH+ neurons, (scale bar: 20 μm), (b) Experimental configuration, (c) Bar graph analysis of spontaneous firing activity of the neurons with or without application of HIV-1 Tat (5ng) into the neuron. (d, f) Representative trace of a spontaneously active dopamine neuron. (e, g): rate histogram of the trace shown in D and F, in which each bar represents spikes activity within 10 second interval. n = 5–7, p < 0.05 t-test.
Discussion
In this study, we have found that the ratio of microglia to dopamine neurons is smaller in the SNc than in the VTA of wild type C57BL/6J mice, suggesting differential constitutive microglial support of dopamine neurons in these two brain regions. Consistent with this hypothesis, we have found a significant decrease in TH immunolabeling in the SNc but not in the VTA following HIV-1 Tat induction. Decreased TH immunolabeling was not accompanied by a concurrent decrease in NeuN staining, a decrease in Th mRNA, or presence of microglial or astrocytic (data not shown) activation. These data warrant the interpretation that HIV-1 Tat in GT-tg mice using the current experimental paradigm does not induce loss of dopaminergic neurons in the SNc, but rather alters the phenotype of dopamine neurons in this region. Since loss of TH immunoreactivity likely reflects reduced enzymatic activity and thus reduced dopamine production, we measured neuronal firing activity in cultured dopamine neurons showing that firing activity is reduced in the presence of HIV-1 Tat. Reduced firing rate is consistent with a reduction in dopamine release, and we deduce that HIV-1 Tat produces a hypodopamine state.
While microglia are present in large numbers in the mouse brain, they are not uniformly distributed (Lawson et al., 1990). Though the variation in the density of F4/80 immunostained microglia amongst brain regions has been shown to be greater than five-fold and particularly dense in the basal ganglia, especially the substantia nigra (Lawson et al., 1990), the ratio of microglia to neurons in each brain region is not well documented. To our knowledge, this is the first study to have examined the ratio of microglia to dopamine neurons in the SNc and VTA. The lower ratio of microglia/TH+ neurons in the SNc underscores diversity of different dopaminergic populations and may explain in part the higher vulnerability of SN vs. VTA neurons to loss of TH immunoreactivity, and the differential vulnerability of SNc neurons to the adverse effects of toxins, oxidative stress or cell death in aging or in PD (Choi et al., 2015; Guzman et al., 2010; Macdonald and Monchi, 2011; Teo et al., 2004). Our findings are consistent with observations by others showing that mouse strains with greater numbers of glial cells (i.e. Swiss Webster vs. C57BL/6J) are more resistant to MPTP-induced neurodegeneration (Smeyne et al., 2005). These observations raise a number of questions about how microglia may interact with dopaminergic neurons under both normal conditions as well as in the presence of Tat when neuronal activity may be compromised. If, as we suspect, the observed reduction of TH immunoreactivity is indicative of neuronal injury or functional compromise, it could be informative to examine the state of neurotrophic factor production by microglial cells within these brain regions to determine whether in fact there is a differential level of constitutive microglial neuroprotection in the SNc vs. VTA.
Alterations in the dopaminergic system are thought to be important for understanding subcortical dementia characteristic of HAND (Berger and Arendt, 2000; Koutsilieri et al., 2002; Purohit et al., 2011). The loss of TH immunoreactivity in the SNc reported here in GT-tg mice is consistent with a reported loss of dopamine neurons and decreased dopamine levels in the human substantia nigra (Itoh et al., 2000; Obermann et al., 2009; Reyes et al., 1991), and associated clinical symptoms such as Parkinson-like movement disorders, bradykinesia, tremor or postural instability in HIV patients (Arendt et al., 1994; Navia et al., 1986) even after antiretroviral therapy (Valcour et al., 2008). Our findings support an involvement of HIV-1 Tat in the loss of dopaminergic neurons in human SNc, but do not show that in the GT-tg mouse neurons have died, at least not after 7 days of HIV-1 Tat induction. Loss of TH immunoreactivity could be an early event in HIV-1 neurotoxicity and may precede neuronal death, which may occur later on, in a manner similar to what has been observed after axotomy of the nigrostriatal pathway (Hagg, 1998). Importantly, our data indicate that the reduction in TH+ neurons represents a loss of immunoreactivity rather than true cell loss because we observed neither microglial activation, macrophage formation, or reactive astrogliosis, which would occur if indeed there was acute neuronal death, as in the case of true (canonical) toxicity, or in the case of age-related loss of SN neurons (Beach et al., 2007). Since we did not find any changes in Th mRNA expression in the SNc following HIV-1 Tat induction, reduced TH immunostaining may be attributable to a reduction or loss of the rate-limiting enzyme for dopamine synthesis, tyrosine hydroxylase (TH). TH enzymatic activity can increase upon phosphorylation (Lindgren et al., 2002) and further studies will determine if the HIV-1 Tat-induced loss of TH immunoreactivity occurs because of a reduction in the phosphorylation of serine or non-serine residues in the TH protein, or because of an increase in dephosphorylation of TH amino acid residues by protein phosphatases.
In any case, loss of TH and reduced firing activity of dopamine neurons following exposure to Tat imply reduced dopamine production and could thus explain the drop in dopamine levels seen in subjects with HAND (Kumar et al., 2009; Purohit et al., 2011). Lower levels of dopamine may also affect microglial cell functions as they are known to bear D1 and D2 receptors (Farber et al., 2005), and could impact their ability to engage in bidirectional communication with dopaminergic neurons.
Lack of microglial activation in the GT-tg bigenic mouse model reported here supports the view that Dox-induced HIV-1 Tat does not trigger an inflammatory response. These results confirm those by others using the same animal model showing that combined Tat induction and morphine exposure, but neither manipulation alone, increased microglial reactivity in the striatum (Bruce-Keller et al., 2008). However, our results also seemingly stand in contrast to studies reporting mild microglial hypertrophy in GT-tg mice (Paris et al., 2015), albeit not in the substantia nigra (which was not studied) but in the VTA at marginally increased levels. Such minimal increases in microglial cell size are likely due to morphological differences among individual cells, i.e. minimal hypertrophy that could reflect variations in microglial morphology, which are commonplace and may not be of functional significance.
Although microglial activation has been reported many times in HIV encephalitis, and also after experimental HIV-1 Tat exposure in vivo and in vitro (Liu et al., 2013; Lu et al., 2011), it is not clear why or how viral infection of microglia would cause the cells to become activated. It seems more likely that microglial function would be impaired by viral entry (as is the case in peripheral lymphocytes), and that neuroinflammation in HIV-infected human brain may be caused by secondary, opportunistic infections, such as toxoplasmosis, or other fungal, viral or bacterial infections commonly seen in these patients (Streit et al., 2014). These opportunistic CNS infections occur because of compromised (microglial) immune function. When HIV-1 enters microglia in the CNS, it likely causes their dysfunction rather than activation, as evidenced histopathologically by presence of multinucleated giant cells (MNGCs), a pathognomonic histopathological hallmark feature of HIV infection in human brain (Michaels et al., 1988). MNGCs have been described in animal models of disease showing dysfunctional, degenerating microglial cells (Fendrick et al., 2007).
Previous reports have shown reductions in microglia using staining for Iba1 and Mac-1 antigens in the mouse brain after weeks of doxycycline administration implying that the use of this antibiotic could confound studies of brain inflammation (Lazzarini et al., 2013; Sultan et al., 2013). We have therefore considered the possibility that 7 days of 100 mg/kg doxycycline administration might affect the number and morphology of microglia and possibly TH immunoreactivity in the SNc. However, as shown in Figures 2 and 3, there is no difference in the number and morphology of neurons and microglia in the SNc of wild type mice exposed to 7 days of 100 mg/kg of doxycycline or saline. These results are consistent with previous reports that 100 mg/kg doxycycline for 14 days had no effect on the number and morphology of microglia (Paris et al., 2014), and that even higher doses of the doxycycline analog, minocycline, did not inhibit microglial activation after nerve injury (Fendrick et al., 2005).
As with all mouse models of human diseases, including HIV-1 infection, there are limitations to the applicability of the GT-tg bigenic model. Perhaps most importantly, there is of course no viral infection and Tat is expressed not in microglia, which are normally targeted by HIV-1 in humans, but instead in astrocytes, and for a much shorter duration. Thus, all findings in this and other models must be interpreted cautiously. However, the fact that we have found a perturbation in dopaminergic neurons, albeit subtle and not as severe as what occurs in human HIV patients, supports the idea that a dopamine deficit may exacerbate progression of HAND/HAD (Purohit et al., 2011). It also shows utility of this animal model encouraging further research into interactions between microglia and dopaminergic neurons.
Figure 7. HIV-1 Tat expression does not affect Th mRNA expression in the SNc.

(a) Line graph shows the respective mouse weights over 7 days of daily intraperitoneal injections of 0.9% saline or doxycycline (Dox, 100 mg/kg) in 0.9% saline for the mice used for performing the quantitative reverse transcription polymerase chain reaction (qRT-PCR), which is shown in panel b. (b) Bar graph shows the fold change in tyrosine hydroxylase (Th) messenger RNA (mRNA) in the substantia nigra pars compacta (SNc) of wild type mice treated for 7 days with Dox (100 mg/kg) in 0.9% saline (n = 6) and GT-tg bigenic (GT) mice treated for 7 days with Dox (100 mg/kg) in 0.9% saline (n = 6) as compared to that of wild type mice treated for 7 days with 0.9% saline (n = 11). Data shown as mean ± SEM and analyzed by one-way ANOVA. One-way ANOVA and Tukey post hoc multiple comparisons tests show no significant difference (p = 0.8661) in Th mRNA expression in the SNc across all experimental groups.
Table 2.
mRNA qRT-PCR primers
| Gene Abbreviation | Gene Full Name | Species | TaqMan Gene Expression Assay Primer Set | Amplicon length |
|---|---|---|---|---|
| Th | tyrosine hydroxylase | Mouse | Mm00447557_m1 | 61 |
| Gapdh | glyceraldehyde-3-phosphate dehydrogenase | Mouse | Mm99999915_g1 | 109 |
Main points.
In wild type mouse, dopamine neurons in the SNc receive less microglial support than VTA dopamine neurons.
HIV-1 Tat perturbation of dopamine neurons is evident by a loss of TH phenotype in the substantia nigra and a loss of firing activity producing a hypodopamine state.
Reduced dopaminergic output is not accompanied by microglial activation but by a decrease in microglial cell numbers in the substantia nigra.
Acknowledgments
This work was supported by NIH funding sources, DA043895, DA026947, NS071122, OD020026, and DA026947S1.
LITERATURE CITED
- Arendt G, Maecker HP, Purrmann J, Homberg V. Control of posture in patients with neurologically asymptomatic HIV infection and patients with beginning HIV-1-related encephalopathy. Arch Neurol. 1994;51:1232–5. doi: 10.1001/archneur.1994.00540240076019. [DOI] [PubMed] [Google Scholar]
- Banuelos C, LaSarge CL, McQuail JA, Hartman JJ, Gilbert RJ, Ormerod BK, Bizon JL. Age-related changes in rostral basal forebrain cholinergic and GABAergic projection neurons: relationship with spatial impairment. Neurobiol Aging. 2013;34:845–62. doi: 10.1016/j.neurobiolaging.2012.06.013. [DOI] [PMC free article] [PubMed] [Google Scholar]
- Barcia C, Ros CM, Annese V, Carrillo-de Sauvage MA, Ros-Bernal F, Gomez A, Yuste JE, Campuzano CM, de Pablos V, Fernandez-Villalba E, Herrero MT. ROCK/Cdc42-mediated microglial motility and gliapse formation lead to phagocytosis of degenerating dopaminergic neurons in vivo. Sci Rep. 2012;2:809. doi: 10.1038/srep00809. [DOI] [PMC free article] [PubMed] [Google Scholar]
- Barcia C, Sanchez Bahillo A, Fernandez-Villalba E, Bautista V, Poza YPM, Fernandez-Barreiro A, Hirsch EC, Herrero MT. Evidence of active microglia in substantia nigra pars compacta of parkinsonian monkeys 1 year after MPTP exposure. Glia. 2004;46:402–9. doi: 10.1002/glia.20015. [DOI] [PubMed] [Google Scholar]
- Barker DJ, Root DH, Zhang S, Morales M. Multiplexed neurochemical signaling by neurons of the ventral tegmental area. J Chem Neuroanat. 2016;73:33–42. doi: 10.1016/j.jchemneu.2015.12.016. [DOI] [PMC free article] [PubMed] [Google Scholar]
- Beach TG, Sue LI, Walker DG, Lue LF, Connor DJ, Caviness JN, Sabbagh MN, Adler CH. Marked microglial reaction in normal aging human substantia nigra: correlation with extraneuronal neuromelanin pigment deposits. Acta Neuropathol. 2007;114:419–24. doi: 10.1007/s00401-007-0250-5. [DOI] [PubMed] [Google Scholar]
- Bell JE, Brettle RP, Chiswick A, Simmonds P. HIV encephalitis, proviral load and dementia in drug users and homosexuals with AIDS. Effect of neocortical involvement. Brain. 1998;121(Pt 11):2043–52. doi: 10.1093/brain/121.11.2043. [DOI] [PubMed] [Google Scholar]
- Benazzouz A, Mamad O, Abedi P, Bouali-Benazzouz R, Chetrit J. Involvement of dopamine loss in extrastriatal basal ganglia nuclei in the pathophysiology of Parkinson’s disease. Front Aging Neurosci. 2014;6:87. doi: 10.3389/fnagi.2014.00087. [DOI] [PMC free article] [PubMed] [Google Scholar]
- Berger JR, Arendt G. HIV dementia: the role of the basal ganglia and dopaminergic systems. J Psychopharmacol. 2000;14:214–21. doi: 10.1177/026988110001400304. [DOI] [PubMed] [Google Scholar]
- Bernheimer H, Birkmayer W, Hornykiewicz O, Jellinger K, Seitelberger F. Brain dopamine and the syndromes of Parkinson and Huntington. Clinical, morphological and neurochemical correlations. J Neurol Sci. 1973;20:415–55. doi: 10.1016/0022-510x(73)90175-5. [DOI] [PubMed] [Google Scholar]
- Bjorklund A, Dunnett SB. Dopamine neuron systems in the brain: an update. Trends Neurosci. 2007;30:194–202. doi: 10.1016/j.tins.2007.03.006. [DOI] [PubMed] [Google Scholar]
- Braak H, Braak E. Nuclear configuration and neuronal types of the nucleus niger in the brain of the human adult. Hum Neurobiol. 1986;5:71–82. [PubMed] [Google Scholar]
- Braak H, Del Tredici K, Rub U, de Vos RA, Jansen Steur EN, Braak E. Staging of brain pathology related to sporadic Parkinson’s disease. Neurobiol Aging. 2003;24:197–211. doi: 10.1016/s0197-4580(02)00065-9. [DOI] [PubMed] [Google Scholar]
- Bruce-Keller AJ. Microglial-neuronal interactions in synaptic damage and recovery. J Neurosci Res. 1999;58:191–201. doi: 10.1002/(sici)1097-4547(19991001)58:1<191::aid-jnr17>3.0.co;2-e. [DOI] [PubMed] [Google Scholar]
- Bruce-Keller AJ, Turchan-Cholewo J, Smart EJ, Geurin T, Chauhan A, Reid R, Xu R, Nath A, Knapp PE, Hauser KF. Morphine causes rapid increases in glial activation and neuronal injury in the striatum of inducible HIV-1 Tat transgenic mice. Glia. 2008;56:1414–27. doi: 10.1002/glia.20708. [DOI] [PMC free article] [PubMed] [Google Scholar]
- Burdo TH, Katner SN, Taffe MA, Fox HS. Neuroimmunity, drugs of abuse, and neuroAIDS. J Neuroimmune Pharmacol. 2006;1:41–9. doi: 10.1007/s11481-005-9001-3. [DOI] [PubMed] [Google Scholar]
- Burns RS, Chiueh CC, Markey SP, Ebert MH, Jacobowitz DM, Kopin IJ. A primate model of parkinsonism: selective destruction of dopaminergic neurons in the pars compacta of the substantia nigra by N-methyl-4-phenyl-1,2,3,6-tetrahydropyridine. Proc Natl Acad Sci U S A. 1983;80:4546–50. doi: 10.1073/pnas.80.14.4546. [DOI] [PMC free article] [PubMed] [Google Scholar]
- Carlsson A, Falck B, Hillarp NA. Cellular localization of brain monoamines. Acta Physiol Scand Suppl. 1962;56:1–28. [PubMed] [Google Scholar]
- Choi SJ, Panhelainen A, Schmitz Y, Larsen KE, Kanter E, Wu M, Sulzer D, Mosharov EV. Changes in neuronal dopamine homeostasis following 1-methyl-4-phenylpyridinium (MPP+) exposure. J Biol Chem. 2015;290:6799–809. doi: 10.1074/jbc.M114.631556. [DOI] [PMC free article] [PubMed] [Google Scholar]
- Dalley JW, Laane K, Theobald DE, Armstrong HC, Corlett PR, Chudasama Y, Robbins TW. Time-limited modulation of appetitive Pavlovian memory by D1 and NMDA receptors in the nucleus accumbens. Proc Natl Acad Sci U S A. 2005;102:6189–94. doi: 10.1073/pnas.0502080102. [DOI] [PMC free article] [PubMed] [Google Scholar]
- Damier P, Hirsch EC, Agid Y, Graybiel AM. The substantia nigra of the human brain. II. Patterns of loss of dopamine-containing neurons in Parkinson’s disease. Brain. 1999;122(Pt 8):1437–48. doi: 10.1093/brain/122.8.1437. [DOI] [PubMed] [Google Scholar]
- Dickson DW, Lee SC, Mattiace LA, Yen SH, Brosnan C. Microglia and cytokines in neurological disease, with special reference to AIDS and Alzheimer’s disease. Glia. 1993;7:75–83. doi: 10.1002/glia.440070113. [DOI] [PubMed] [Google Scholar]
- Double KL, Reyes S, Werry EL, Halliday GM. Selective cell death in neurodegeneration: why are some neurons spared in vulnerable regions? Prog Neurobiol. 2010;92:316–29. doi: 10.1016/j.pneurobio.2010.06.001. [DOI] [PubMed] [Google Scholar]
- Eyo UB, Wu LJ. Bidirectional microglia-neuron communication in the healthy brain. Neural Plast. 2013;2013:456857. doi: 10.1155/2013/456857. [DOI] [PMC free article] [PubMed] [Google Scholar]
- Farber K, Pannasch U, Kettenmann H. Dopamine and noradrenaline control distinct functions in rodent microglial cells. Mol Cell Neurosci. 2005;29:128–38. doi: 10.1016/j.mcn.2005.01.003. [DOI] [PubMed] [Google Scholar]
- Fatima M, Prajapati B, Saleem K, Kumari R, Mohindar Singh Singal C, Seth P. Novel insights into role of miR-320a-VDAC1 axis in astrocyte-mediated neuronal damage in neuroAIDS. Glia. 2017;65:250–263. doi: 10.1002/glia.23089. [DOI] [PubMed] [Google Scholar]
- Fearnley JM, Lees AJ. Ageing and Parkinson’s disease: substantia nigra regional selectivity. Brain. 1991;114(Pt 5):2283–301. doi: 10.1093/brain/114.5.2283. [DOI] [PubMed] [Google Scholar]
- Fendrick SE, Miller KR, Streit WJ. Minocycline does not inhibit microglia proliferation or neuronal regeneration in the facial nucleus following crush injury. Neurosci Lett. 2005;385:220–3. doi: 10.1016/j.neulet.2005.05.047. [DOI] [PubMed] [Google Scholar]
- Fendrick SE, Xue QS, Streit WJ. Formation of multinucleated giant cells and microglial degeneration in rats expressing a mutant Cu/Zn superoxide dismutase gene. J Neuroinflammation. 2007;4:9. doi: 10.1186/1742-2094-4-9. [DOI] [PMC free article] [PubMed] [Google Scholar]
- Fog JU, Khoshbouei H, Daws LC, Sitte HH, Javitch JA, Gether U. Calmodulin kinase II interacts with the dopamine transporter C terminus to regulate amphetamine-induced reverse transport. Neuron. 2006;51:417–29. doi: 10.1016/j.neuron.2006.06.028. [DOI] [PubMed] [Google Scholar]
- Fu Y, Yuan Y, Halliday G, Rusznak Z, Watson C, Paxinos G. A cytoarchitectonic and chemoarchitectonic analysis of the dopamine cell groups in the substantia nigra, ventral tegmental area, and retrorubral field in the mouse. Brain Struct Funct. 2012;217:591–612. doi: 10.1007/s00429-011-0349-2. [DOI] [PubMed] [Google Scholar]
- Garden GA. Microglia in human immunodeficiency virus-associated neurodegeneration. Glia. 2002;40:240–51. doi: 10.1002/glia.10155. [DOI] [PubMed] [Google Scholar]
- German DC, Manaye KF, Sonsalla PK, Brooks BA. Midbrain dopaminergic cell loss in Parkinson’s disease and MPTP-induced parkinsonism: sparing of calbindin-D28k-containing cells. Ann N Y Acad Sci. 1992;648:42–62. doi: 10.1111/j.1749-6632.1992.tb24523.x. [DOI] [PubMed] [Google Scholar]
- Gibb WR, Lees AJ. Anatomy, pigmentation, ventral and dorsal subpopulations of the substantia nigra, and differential cell death in Parkinson’s disease. J Neurol Neurosurg Psychiatry. 1991;54:388–96. doi: 10.1136/jnnp.54.5.388. [DOI] [PMC free article] [PubMed] [Google Scholar]
- Gnegy ME, Khoshbouei H, Berg KA, Javitch JA, Clarke WP, Zhang M, Galli A. Intracellular Ca2+ regulates amphetamine-induced dopamine efflux and currents mediated by the human dopamine transporter. Mol Pharmacol. 2004;66:137–43. doi: 10.1124/mol.66.1.137. [DOI] [PubMed] [Google Scholar]
- Grace AA, Bunney BS. The control of firing pattern in nigral dopamine neurons: single spike firing. J Neurosci. 1984;4:2866–76. doi: 10.1523/JNEUROSCI.04-11-02866.1984. [DOI] [PMC free article] [PubMed] [Google Scholar]
- Greenfield JG, Bosanquet FD. The brain-stem lesions in Parkinsonism. J Neurol Neurosurg Psychiatry. 1953;16:213–26. doi: 10.1136/jnnp.16.4.213. [DOI] [PMC free article] [PubMed] [Google Scholar]
- Guzman JN, Sanchez-Padilla J, Wokosin D, Kondapalli J, Ilijic E, Schumacker PT, Surmeier DJ. Oxidant stress evoked by pacemaking in dopaminergic neurons is attenuated by DJ-1. Nature. 2010;468:696–700. doi: 10.1038/nature09536. [DOI] [PMC free article] [PubMed] [Google Scholar]
- Hagg T. Neurotrophins prevent death and differentially affect tyrosine hydroxylase of adult rat nigrostriatal neurons in vivo. Exp Neurol. 1998;149:183–92. doi: 10.1006/exnr.1997.6684. [DOI] [PubMed] [Google Scholar]
- Halliday GM, Tork I. Comparative anatomy of the ventromedial mesencephalic tegmentum in the rat, cat, monkey and human. J Comp Neurol. 1986;252:423–45. doi: 10.1002/cne.902520402. [DOI] [PubMed] [Google Scholar]
- Hernandez PJ, Andrzejewski ME, Sadeghian K, Panksepp JB, Kelley AE. AMPA/kainate, NMDA, and dopamine D1 receptor function in the nucleus accumbens core: a context-limited role in the encoding and consolidation of instrumental memory. Learn Mem. 2005;12:285–95. doi: 10.1101/lm.93105. [DOI] [PMC free article] [PubMed] [Google Scholar]
- Hirsch EC, Graybiel AM, Agid Y. Selective vulnerability of pigmented dopaminergic neurons in Parkinson’s disease. Acta Neurol Scand Suppl. 1989;126:19–22. doi: 10.1111/j.1600-0404.1989.tb01778.x. [DOI] [PubMed] [Google Scholar]
- Hornykiewicz O, Kish SJ. Biochemical pathophysiology of Parkinson’s disease. Adv Neurol. 1987;45:19–34. [PubMed] [Google Scholar]
- Hosp JA, Pekanovic A, Rioult-Pedotti MS, Luft AR. Dopaminergic projections from midbrain to primary motor cortex mediate motor skill learning. J Neurosci. 2011;31:2481–7. doi: 10.1523/JNEUROSCI.5411-10.2011. [DOI] [PMC free article] [PubMed] [Google Scholar]
- Itoh K, Mehraein P, Weis S. Neuronal damage of the substantia nigra in HIV-1 infected brains. Acta Neuropathol. 2000;99:376–84. doi: 10.1007/s004010051139. [DOI] [PubMed] [Google Scholar]
- Kim BO, Liu Y, Ruan Y, Xu ZC, Schantz L, He JJ. Neuropathologies in transgenic mice expressing human immunodeficiency virus type 1 Tat protein under the regulation of the astrocyte-specific glial fibrillary acidic protein promoter and doxycycline. Am J Pathol. 2003;162:1693–707. doi: 10.1016/S0002-9440(10)64304-0. [DOI] [PMC free article] [PubMed] [Google Scholar]
- Koutsilieri E, Sopper S, Scheller C, ter Meulen V, Riederer P. Involvement of dopamine in the progression of AIDS Dementia Complex. J Neural Transm (Vienna) 2002;109:399–410. doi: 10.1007/s007020200032. [DOI] [PubMed] [Google Scholar]
- Kumar AM, Fernandez JB, Singer EJ, Commins D, Waldrop-Valverde D, Ownby RL, Kumar M. Human immunodeficiency virus type 1 in the central nervous system leads to decreased dopamine in different regions of postmortem human brains. J Neurovirol. 2009;15:257–74. doi: 10.1080/13550280902973952. [DOI] [PMC free article] [PubMed] [Google Scholar]
- Kwak Y, Muller ML, Bohnen NI, Dayalu P, Seidler RD. Effect of dopaminergic medications on the time course of explicit motor sequence learning in Parkinson’s disease. J Neurophysiol. 2010;103:942–9. doi: 10.1152/jn.00197.2009. [DOI] [PubMed] [Google Scholar]
- Kwak Y, Muller ML, Bohnen NI, Dayalu P, Seidler RD. l-DOPA changes ventral striatum recruitment during motor sequence learning in Parkinson’s disease. Behav Brain Res. 2012;230:116–24. doi: 10.1016/j.bbr.2012.02.006. [DOI] [PubMed] [Google Scholar]
- Lawson LJ, Perry VH, Dri P, Gordon S. Heterogeneity in the distribution and morphology of microglia in the normal adult mouse brain. Neuroscience. 1990;39:151–70. doi: 10.1016/0306-4522(90)90229-w. [DOI] [PubMed] [Google Scholar]
- Lazzarini M, Martin S, Mitkovski M, Vozari RR, Stuhmer W, Bel ED. Doxycycline restrains glia and confers neuroprotection in a 6-OHDA Parkinson model. Glia. 2013;61:1084–100. doi: 10.1002/glia.22496. [DOI] [PubMed] [Google Scholar]
- Lein ES, Hawrylycz MJ, Ao N, Ayres M, Bensinger A, Bernard A, Boe AF, Boguski MS, Brockway KS, Byrnes EJ, Chen L, Chen L, Chen TM, Chin MC, Chong J, Crook BE, Czaplinska A, Dang CN, Datta S, Dee NR, Desaki AL, Desta T, Diep E, Dolbeare TA, Donelan MJ, Dong HW, Dougherty JG, Duncan BJ, Ebbert AJ, Eichele G, Estin LK, Faber C, Facer BA, Fields R, Fischer SR, Fliss TP, Frensley C, Gates SN, Glattfelder KJ, Halverson KR, Hart MR, Hohmann JG, Howell MP, Jeung DP, Johnson RA, Karr PT, Kawal R, Kidney JM, Knapik RH, Kuan CL, Lake JH, Laramee AR, Larsen KD, Lau C, Lemon TA, Liang AJ, Liu Y, Luong LT, Michaels J, Morgan JJ, Morgan RJ, Mortrud MT, Mosqueda NF, Ng LL, Ng R, Orta GJ, Overly CC, Pak TH, Parry SE, Pathak SD, Pearson OC, Puchalski RB, Riley ZL, Rockett HR, Rowland SA, Royall JJ, Ruiz MJ, Sarno NR, Schaffnit K, Shapovalova NV, Sivisay T, Slaughterbeck CR, Smith SC, Smith KA, Smith BI, Sodt AJ, Stewart NN, Stumpf KR, Sunkin SM, Sutram M, Tam A, Teemer CD, Thaller C, Thompson CL, Varnam LR, Visel A, Whitlock RM, Wohnoutka PE, Wolkey CK, Wong VY, Wood M, Yaylaoglu MB, Young RC, Youngstrom BL, Yuan XF, Zhang B, Zwingman TA, Jones AR. Genome-wide atlas of gene expression in the adult mouse brain. Nature. 2007;445:168–76. doi: 10.1038/nature05453. [DOI] [PubMed] [Google Scholar]
- Lin M, Sambo D, Khoshbouei H. Methamphetamine Regulation of Firing Activity of Dopamine Neurons. J Neurosci. 2016;36:10376–10391. doi: 10.1523/JNEUROSCI.1392-16.2016. [DOI] [PMC free article] [PubMed] [Google Scholar]
- Lindgren N, Goiny M, Herrera-Marschitz M, Haycock JW, Hokfelt T, Fisone G. Activation of extracellular signal-regulated kinases 1 and 2 by depolarization stimulates tyrosine hydroxylase phosphorylation and dopamine synthesis in rat brain. Eur J Neurosci. 2002;15:769–73. doi: 10.1046/j.1460-9568.2002.01901.x. [DOI] [PubMed] [Google Scholar]
- Liu J, Xu P, Collins C, Liu H, Zhang J, Keblesh JP, Xiong H. HIV-1 Tat protein increases microglial outward K(+) current and resultant neurotoxic activity. PLoS One. 2013;8:e64904. doi: 10.1371/journal.pone.0064904. [DOI] [PMC free article] [PubMed] [Google Scholar]
- Livak KJ, Schmittgen TD. Analysis of relative gene expression data using real-time quantitative PCR and the 2(−Delta Delta C(T)) Method. Methods. 2001;25:402–8. doi: 10.1006/meth.2001.1262. [DOI] [PubMed] [Google Scholar]
- Lu SM, Tremblay ME, King IL, Qi J, Reynolds HM, Marker DF, Varrone JJ, Majewska AK, Dewhurst S, Gelbard HA. HIV-1 Tat-induced microgliosis and synaptic damage via interactions between peripheral and central myeloid cells. PLoS One. 2011;6:e23915. doi: 10.1371/journal.pone.0023915. [DOI] [PMC free article] [PubMed] [Google Scholar]
- Macdonald PA, Monchi O. Differential effects of dopaminergic therapies on dorsal and ventral striatum in Parkinson’s disease: implications for cognitive function. Parkinsons Dis. 2011;2011:572743. doi: 10.4061/2011/572743. [DOI] [PMC free article] [PubMed] [Google Scholar]
- McCann MJ, O’Callaghan JP, Martin PM, Bertram T, Streit WJ. Differential activation of microglia and astrocytes following trimethyl tin-induced neurodegeneration. Neuroscience. 1996;72:273–81. doi: 10.1016/0306-4522(95)00526-9. [DOI] [PubMed] [Google Scholar]
- Michaels J, Price RW, Rosenblum MK. Microglia in the giant cell encephalitis of acquired immune deficiency syndrome: proliferation, infection and fusion. Acta Neuropathol. 1988;76:373–9. doi: 10.1007/BF00686974. [DOI] [PubMed] [Google Scholar]
- Molina-Luna K, Pekanovic A, Rohrich S, Hertler B, Schubring-Giese M, Rioult-Pedotti MS, Luft AR. Dopamine in motor cortex is necessary for skill learning and synaptic plasticity. PLoS One. 2009;4:e7082. doi: 10.1371/journal.pone.0007082. [DOI] [PMC free article] [PubMed] [Google Scholar]
- Morgan JT, Chana G, Abramson I, Semendeferi K, Courchesne E, Everall IP. Abnormal microglial-neuronal spatial organization in the dorsolateral prefrontal cortex in autism. Brain Res. 2012;1456:72–81. doi: 10.1016/j.brainres.2012.03.036. [DOI] [PubMed] [Google Scholar]
- Navia BA, Jordan BD, Price RW. The AIDS dementia complex: I. Clinical features. Ann Neurol. 1986;19:517–24. doi: 10.1002/ana.410190602. [DOI] [PubMed] [Google Scholar]
- Navratilova E, Morimura K, Xie JY, Atcherley CW, Ossipov MH, Porreca F. Positive emotions and brain reward circuits in chronic pain. J Comp Neurol. 2016;524:1646–52. doi: 10.1002/cne.23968. [DOI] [PMC free article] [PubMed] [Google Scholar]
- Nestler EJ, Hyman SE, Malenka RC. Molecular Neuropharmacology: A Foundation for Clinical Neuroscience. NewYork: McGraw-Hill Medical; 2009. [Google Scholar]
- Obermann M, Kuper M, Kastrup O, Yaldizli O, Esser S, Thiermann J, Koutsilieri E, Arendt G, Diener HC, Maschke M German Competence Network HA. Substantia nigra hyperechogenicity and CSF dopamine depletion in HIV. J Neurol. 2009;256:948–53. doi: 10.1007/s00415-009-5052-3. [DOI] [PubMed] [Google Scholar]
- Pannell M, Szulzewsky F, Matyash V, Wolf SA, Kettenmann H. The subpopulation of microglia sensitive to neurotransmitters/neurohormones is modulated by stimulation with LPS, interferon-gamma, and IL-4. Glia. 2014;62:667–79. doi: 10.1002/glia.22633. [DOI] [PubMed] [Google Scholar]
- Paris JJ, Singh HD, Carey AN, McLaughlin JP. Exposure to HIV-1 Tat in brain impairs sensorimotor gating and activates microglia in limbic and extralimbic brain regions of male mice. Behav Brain Res. 2015;291:209–18. doi: 10.1016/j.bbr.2015.05.021. [DOI] [PMC free article] [PubMed] [Google Scholar]
- Paris JJ, Singh HD, Ganno ML, Jackson P, McLaughlin JP. Anxiety-like behavior of mice produced by conditional central expression of the HIV-1 regulatory protein, Tat. Psychopharmacology (Berl) 2014;231:2349–60. doi: 10.1007/s00213-013-3385-1. [DOI] [PMC free article] [PubMed] [Google Scholar]
- Poulin JF, Zou J, Drouin-Ouellet J, Kim KY, Cicchetti F, Awatramani RB. Defining midbrain dopaminergic neuron diversity by single-cell gene expression profiling. Cell Rep. 2014;9:930–43. doi: 10.1016/j.celrep.2014.10.008. [DOI] [PMC free article] [PubMed] [Google Scholar]
- Purohit V, Rapaka R, Shurtleff D. Drugs of abuse, dopamine, and HIV-associated neurocognitive disorders/HIV-associated dementia. Mol Neurobiol. 2011;44:102–10. doi: 10.1007/s12035-011-8195-z. [DOI] [PubMed] [Google Scholar]
- Reyes MG, Faraldi F, Senseng CS, Flowers C, Fariello R. Nigral degeneration in acquired immune deficiency syndrome (AIDS) Acta Neuropathol. 1991;82:39–44. doi: 10.1007/BF00310921. [DOI] [PubMed] [Google Scholar]
- Richardson BD, Saha K, Krout D, Cabrera E, Felts B, Henry LK, Swant J, Zou MF, Newman AH, Khoshbouei H. Membrane potential shapes regulation of dopamine transporter trafficking at the plasma membrane. Nat Commun. 2016;7:10423. doi: 10.1038/ncomms10423. [DOI] [PMC free article] [PubMed] [Google Scholar]
- Saha K, Sambo D, Richardson BD, Lin LM, Butler B, Villarroel L, Khoshbouei H. Intracellular methamphetamine prevents the dopamine-induced enhancement of neuronal firing. J Biol Chem. 2014;289:22246–57. doi: 10.1074/jbc.M114.563056. [DOI] [PMC free article] [PubMed] [Google Scholar]
- Sambo DO, Lin M, Owens A, Lebowitz JJ, Richardson B, Jagnarine DA, Shetty M, Rodriquez M, Alonge T, Ali M, Katz J, Yan L, Febo M, Henry LK, Bruijnzeel AW, Daws L, Khoshbouei H. The sigma-1 receptor modulates methamphetamine dysregulation of dopamine neurotransmission. Nat Commun. 2017;8:2228. doi: 10.1038/s41467-017-02087-x. [DOI] [PMC free article] [PubMed] [Google Scholar]
- Simioni S, Cavassini M, Annoni JM, Rimbault Abraham A, Bourquin I, Schiffer V, Calmy A, Chave JP, Giacobini E, Hirschel B, Du Pasquier RA. Cognitive dysfunction in HIV patients despite long-standing suppression of viremia. AIDS. 2010;24:1243–50. doi: 10.1097/QAD.0b013e3283354a7b. [DOI] [PubMed] [Google Scholar]
- Smeyne M, Jiao Y, Shepherd KR, Smeyne RJ. Glia cell number modulates sensitivity to MPTP in mice. Glia. 2005;52:144–52. doi: 10.1002/glia.20233. [DOI] [PubMed] [Google Scholar]
- Streit WJ. Microglial-neuronal interactions. J Chem Neuroanat. 1993;6:261–6. doi: 10.1016/0891-0618(93)90047-8. [DOI] [PubMed] [Google Scholar]
- Streit WJ. Microglia as neuroprotective, immunocompetent cells of the CNS. Glia. 2002;40:133–9. doi: 10.1002/glia.10154. [DOI] [PubMed] [Google Scholar]
- Streit WJ, Hurley SD, McGraw TS, Semple-Rowland SL. Comparative evaluation of cytokine profiles and reactive gliosis supports a critical role for interleukin-6 in neuron-glia signaling during regeneration. J Neurosci Res. 2000;61:10–20. doi: 10.1002/1097-4547(20000701)61:1<10::AID-JNR2>3.0.CO;2-E. [DOI] [PubMed] [Google Scholar]
- Streit WJ, Kreutzberg GW. Response of endogenous glial cells to motor neuron degeneration induced by toxic ricin. J Comp Neurol. 1988;268:248–63. doi: 10.1002/cne.902680209. [DOI] [PubMed] [Google Scholar]
- Streit WJ, Walter SA, Pennell NA. Reactive microgliosis. Prog Neurobiol. 1999;57:563–81. doi: 10.1016/s0301-0082(98)00069-0. [DOI] [PubMed] [Google Scholar]
- Streit WJ, Xue QS, Braak H, del Tredici K. Presence of severe neuroinflammation does not intensify neurofibrillary degeneration in human brain. Glia. 2014;62:96–105. doi: 10.1002/glia.22589. [DOI] [PubMed] [Google Scholar]
- Sultan S, Gebara E, Toni N. Doxycycline increases neurogenesis and reduces microglia in the adult hippocampus. Front Neurosci. 2013;7:131. doi: 10.3389/fnins.2013.00131. [DOI] [PMC free article] [PubMed] [Google Scholar]
- Teo MY, van Wyk M, Lin J, Lipski J. Differential effects of nicotine on the activity of substantia nigra and ventral tegmental area dopaminergic neurons in vitro. Acta Neurobiol Exp (Wars) 2004;64:119–30. doi: 10.55782/ane-2004-1498. [DOI] [PubMed] [Google Scholar]
- Tremblay L, Worbe Y, Thobois S, Sgambato-Faure V, Feger J. Selective dysfunction of basal ganglia subterritories: From movement to behavioral disorders. Mov Disord. 2015;30:1155–70. doi: 10.1002/mds.26199. [DOI] [PubMed] [Google Scholar]
- Tsuda M, Beggs S, Salter MW, Inoue K. Microglia and intractable chronic pain. Glia. 2013;61:55–61. doi: 10.1002/glia.22379. [DOI] [PubMed] [Google Scholar]
- Valcour V, Watters MR, Williams AE, Sacktor N, McMurtray A, Shikuma C. Aging exacerbates extrapyramidal motor signs in the era of highly active antiretroviral therapy. J Neurovirol. 2008;14:362–7. doi: 10.1080/13550280802216494. [DOI] [PMC free article] [PubMed] [Google Scholar]
- Virgone-Carlotta A, Uhlrich J, Akram MN, Ressnikoff D, Chretien F, Domenget C, Gherardi R, Despars G, Jurdic P, Honnorat J, Nataf S, Touret M. Mapping and kinetics of microglia/neuron cell-to-cell contacts in the 6-OHDA murine model of Parkinson’s disease. Glia. 2013;61:1645–58. doi: 10.1002/glia.22546. [DOI] [PubMed] [Google Scholar]
- Zaborszky L, Vadasz C. The midbrain dopaminergic system: anatomy and genetic variation in dopamine neuron number of inbred mouse strains. Behav Genet. 2001;31:47–59. doi: 10.1023/a:1010257808945. [DOI] [PubMed] [Google Scholar]
- Zauli G, Secchiero P, Rodella L, Gibellini D, Mirandola P, Mazzoni M, Milani D, Dowd DR, Capitani S, Vitale M. HIV-1 Tat-mediated inhibition of the tyrosine hydroxylase gene expression in dopaminergic neuronal cells. J Biol Chem. 2000;275:4159–65. doi: 10.1074/jbc.275.6.4159. [DOI] [PubMed] [Google Scholar]