
Figure 2.
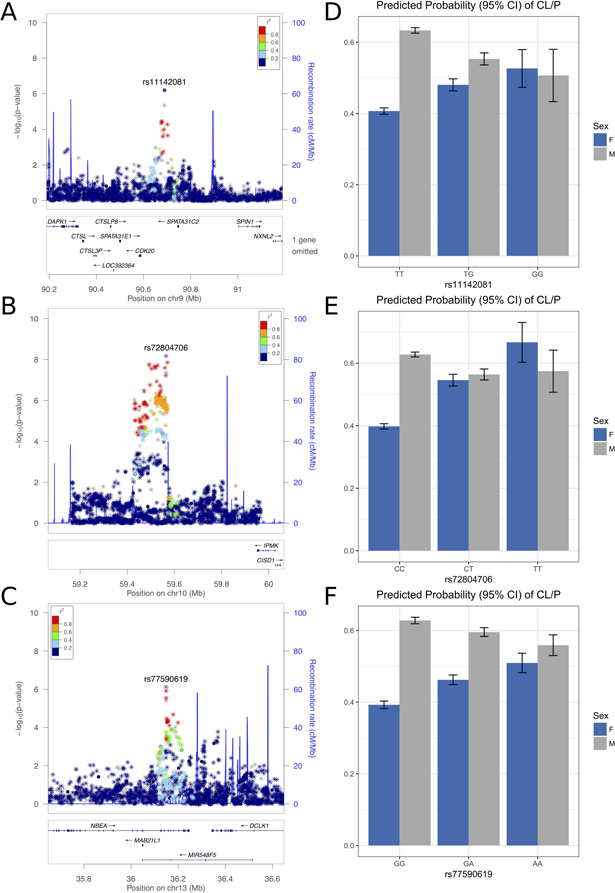
Results for the 9q22.1 (A,D), 10q21.1 (B,E), and 13q13.3 (C,F) loci. Regional association plot show results for the gene-by-sex effect model. Points are color-coded based on linkage disequilbrium (r2) in Europeans. Plots were generated with LocusZoom (Pruim et al., 2010). Bar charts of the predicted probability of CL/P are shown, stratified by sex and adjusting for principal components of ancestry. Plots were generated with the ggplot2 package in R (R Core Team, 2017; Wickham, 2009).