
Figure 2. Kv1.3 knockout alters microglial response to LPS exemplified by K+ channel expression.
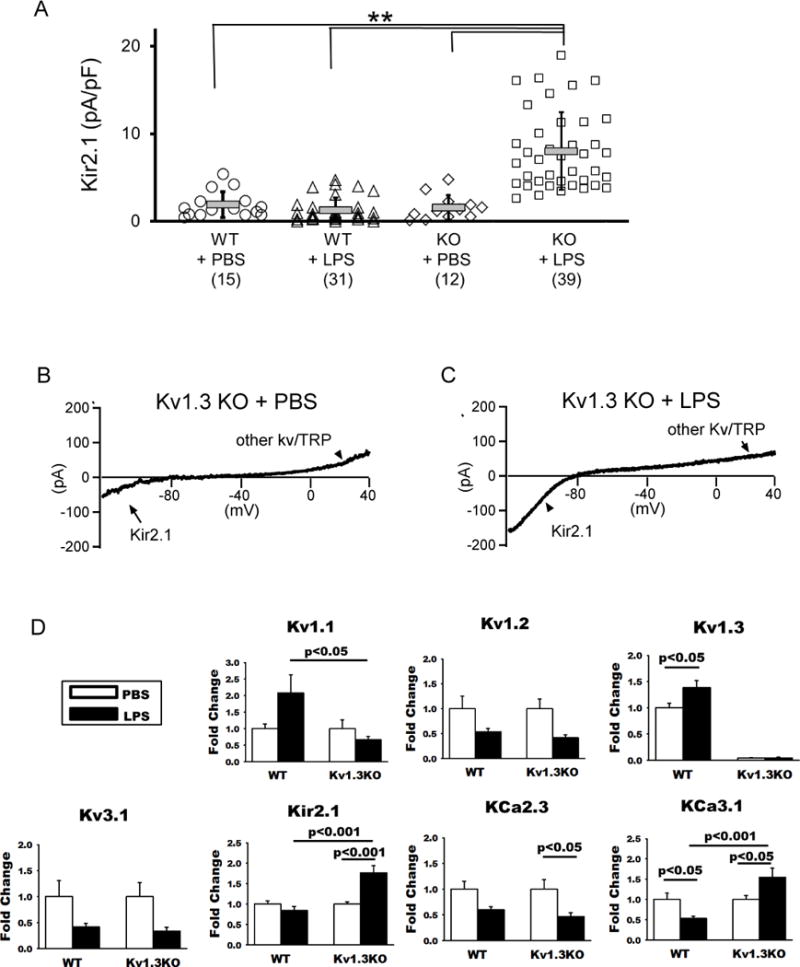
Kv1.3WT and Kv1.3KO mice at three months of age received ICV injection of LPS or vehicle (PBS). Twenty-four hours after injection, microglia were acutely isolated by immunopanning and immediately studied by whole-cell patch clamp and qPCR quantification of RNA. (A) Scatterplot showing Kir2.1 current density measured on microglia acutely isolated from WT and Kv1.3 KO mice: Kv1.3 WT + PBS (1.92 + 1.48 pA/pF, n = 15), Kv1.3 WT + LPS (1.26 + 1.40 pA/pF, n = 31), Kv1.3 KO + PBS (1.55 + 1.41 pA/pF, n = 12) and Kv1.3 KO + LPS (8.02 + 4.43 pA/pF, n = 39). Data are presented as mean ± S.D., **p<0.001. Statistical significance was determined using paired Student’s t-test. (B) A representative current tracing of a microglia acutely isolated from a Kv1.3 KO mouse receiving ICV-PBS showing peak inward currents at −120 mV, characteristic of Kir2.1. (C) The Kir2.1 currents were augmented in a microglia acutely isolated from a Kv1.3 KO mouse receiving ICV-LPS. (D) RNA was isolated from WT mice receiving ICV-PBS (n = 10) and ICV-LPS (n = 10), and Kv1.3 KO mice receiving ICV-PBS (n = 11) and ICV-LPS (n = 12). Shown are qPCR results of indicated microglial K+ channel genes. Data are presented as mean ± SEM. Statistical analysis was performed by two-way ANOVA with Bonferroni correction for multiple comparisons.