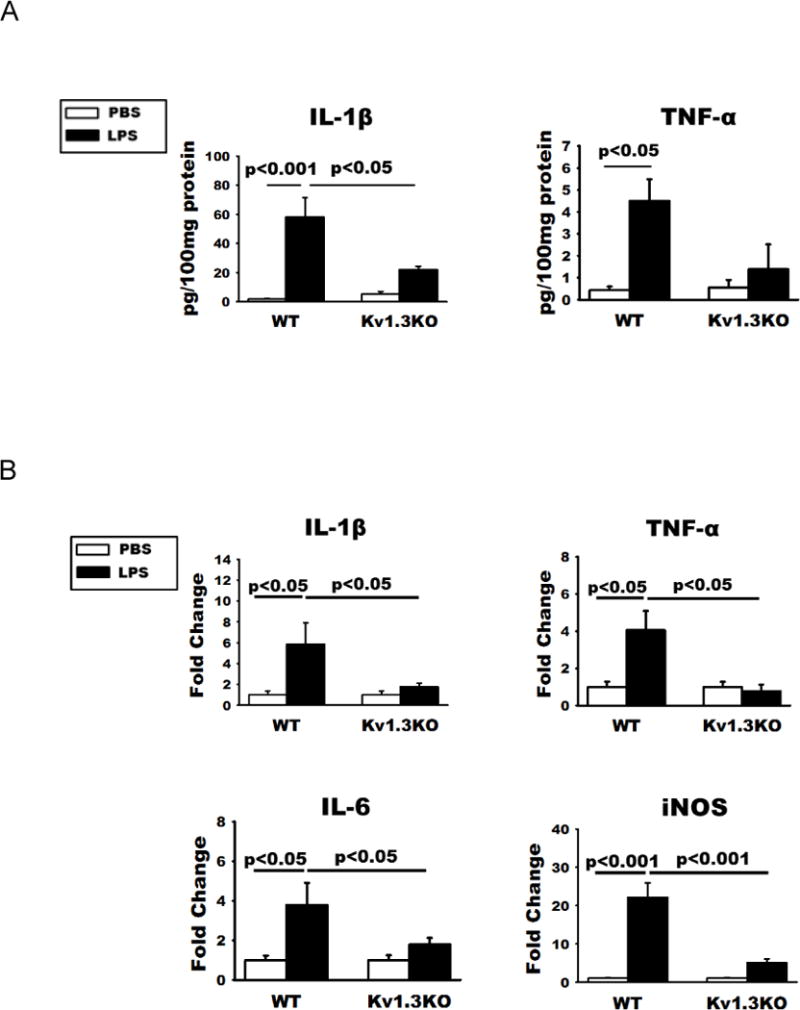
Figure 4. LPS-induced pro-inflammatory phenotype of microglia requires Kv1.3 expression in vivo.

(A) ELISA quantification of IL-1β and TNF-α levels in brain homogenates of these mice showed that increased production of the two pro-inflammatory cytokines were curbed by Kv1.3 knockout. (B) qPCR quantification of the RNA of indicated molecules showed increases of pro-inflammation cytokines and iNOS mRNA in microglia acutely isolated from WT mice at 24h after ICV-LPS. These increases were absent in Kv1.3KO mice. Data are presented as means ± SEM. There are no statistical differences in all measures between Kv1.3KO/PBS and Kv1.3KO/LPS groups. RNA was isolated from WT mice receiving ICV-PBS (n =10) and ICV-LPS (n = 10), and Kv1.3 KO mice receiving ICV-PBS (n = 11) and ICV-LPS (n = 12). Statistical analysis was performed by two-way ANOVA follow by Bonferroni correction for multiple comparisons.
