
Figure 7. PAP-1 treatment reverses the LPS-induced hLTP deficit.
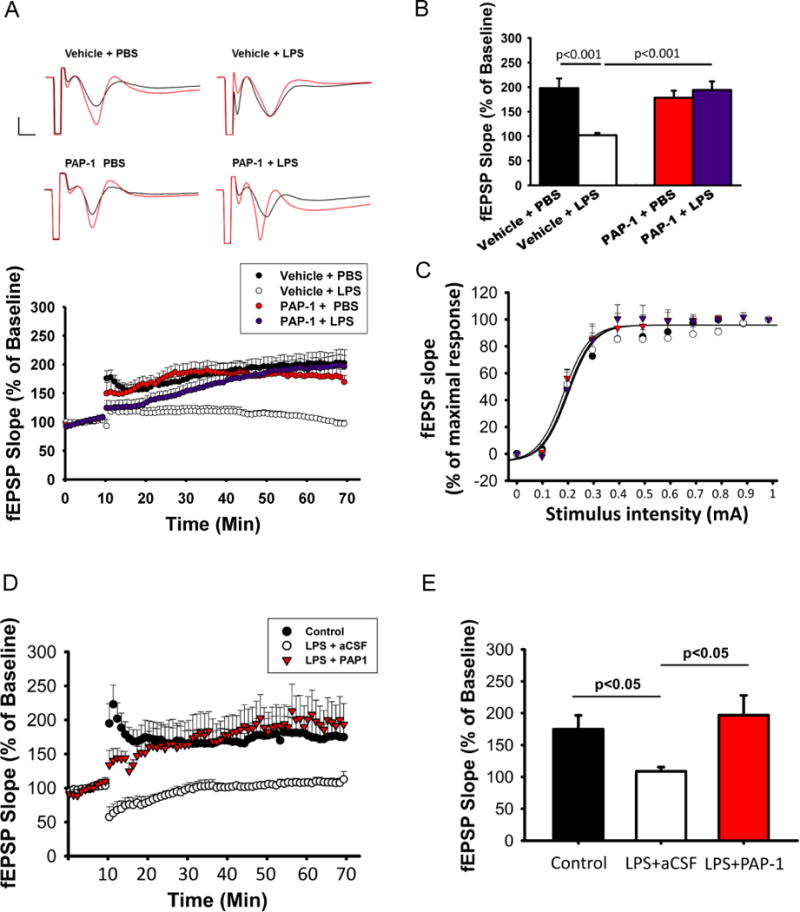
WT mice received ICV-PBS or ICV-LPS and one hour later received intraperitoneal injection of PAP-1 (40 mg/kg) or the vehicle (Miglyol-812). Twenty-four hours later, hippocampal slices were used for hLTP measurement. (A) Time course of hLTP induced with high frequency stimulation showing that ICV-LPS injection reduced the amplitude of LTP but this reduction was mitigated by PAP-1 treatment. (B) Summary bar graphs showing the average fEPSP slope between 50 and 60 minutes after high frequency stimulation. Data were compiled from recordings using slices obtained from the groups of Vehicle/PBS (10 slices from 3 mice), Vehicle/LPS (12 slices from 3 mice), PAP-1/PBS (10 slices from 3 mice), and PAP-1/LPS (12 slices from 3 mice) and are presented as mean percent change in fEPSP slope ± SEM from baseline. Bar scale: 0.5mV/5ms. Two-way ANOVA follow by Bonferroni post hoc test. (C) Input/output relationship shows no difference in basal transmission before LTP induction; the curves were constructed by increasing stimulation current intensity ranged from 0 to 1 mA with steps of 0.1mA. (D-E) WT mice at three months of age received ICV injection of LPS or PBS. Twenty-four hours after injection, hippocampal slices were used for hLTP measurement. Slices from mice receiving ICV-LPS were preincubated with PAP-1 (1 μM) or aCSF for 45 min before LTP induction. PAP-1 was also continuously perfused during the recording. (D) Traces and time course of fEPSP slope. (E) Summary bar graphs showing the average fEPSP slope between 50 and 60 minutes after high frequency stimulation. Data were compiled from recordings using slices obtained from the groups of control (7 slices from 3 mice), LPS (4 slices from 2 mice), and LPS/PAP-1 (4 slices from 2 mice), and are presented as mean percent change in fEPSP slope ± SEM from baseline. Two-way ANOVA follow by Bonferroni post hoc test.