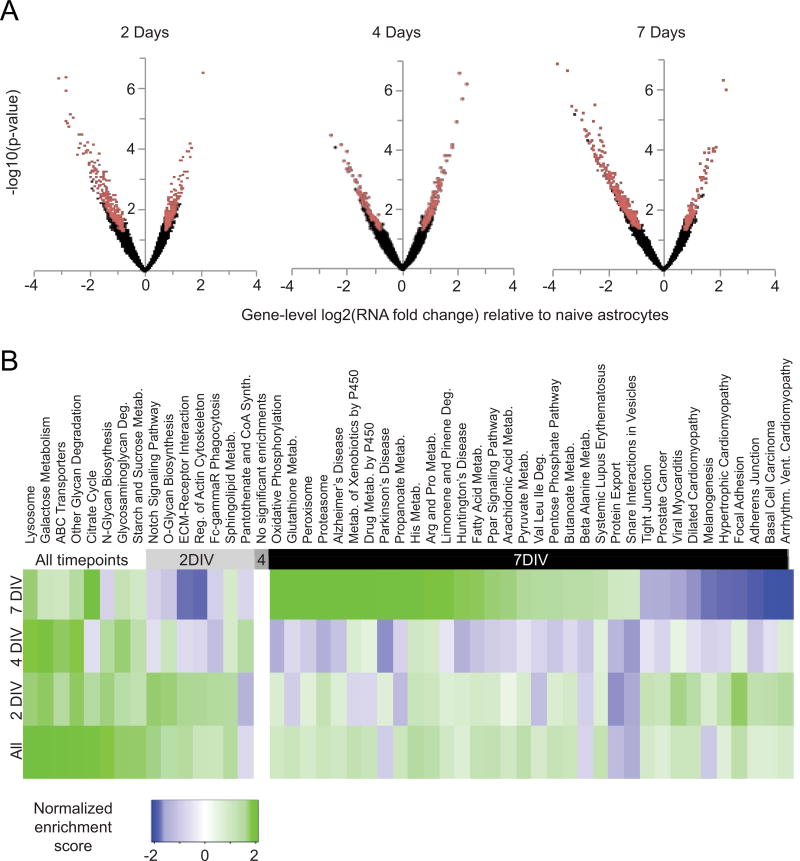
Figure 2. Co-culture of astrocytes with neurons results in transcriptome changes in astrocytes during neuronal maturation.
A) Volcano plots of RNA-seq analysis showing all genes expressed in astrocytes with increasing days in co-culture. The x-axis shows the magnitude of change (astrocytes co-cultured with neurons / naïve astrocytes). The y-axis shows significance values; a false discovery rate (FDR)-adjusted P value of .001 is 3 on this scale. Red dots are genes differentially expressed between co-cultured and naïve astrocytes, defined as those with greater than 1.6-fold expression differences and adjusted p-values less than .05 by both tagwise and common dispersion estimates. Black dots are genes not classified as differentially expressed. B) Gene Set Enrichment Analysis (GSEA) results showing biological pathways whose genes are coordinately up- or down-regulated. Pathways are defined according to the annotated KEGG database (Kanehisa & Goto, 2000). The normalized enrichment score is higher when pathway genes are more differentially expressed between naïve astrocytes and astrocytes in neuronal co-culture. Therefore, green boxes represent pathways up-regulated in astrocytes in neuronal co-culture, while blue boxes represent pathways down-regulated in neuronal co-culture. Only significant results (FDR< .01) are shown.

