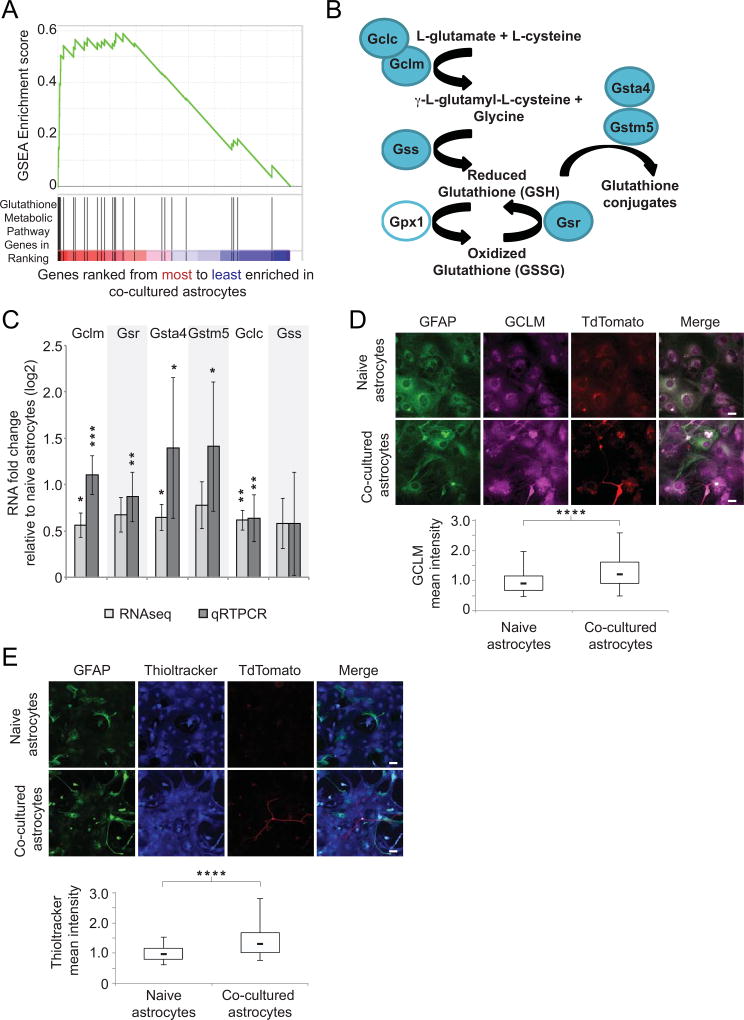
Figure 3. Glutathione metabolic genes and glutathione production in astrocytes are up-regulated in neuronal co-culture.
A) Gene Set Enrichment Analysis (GSEA) showing KEGG-defined glutathione metabolic genes in co-cultured astrocytes relative to naïve astrocytes after seven days in culture. The heat map shows the ranking of genes according to their expression difference between astrocytes in co-culture with neurons relative to naïve astrocytes. Black vertical lines indicate rank location of glutathione metabolism genes annotated by KEGG. Green line designates the running sum of the calculation for the total enrichment score. Positive enrichment scores indicate enrichment at the top of the ranked list. B) Schematic of proteins in the glutathione synthesis pathway. Enzymes with blue fill were identified as up-regulated in astrocytes in response to neuronal co-culture. C) qRT-PCR results for glutathione pathway genes from three independent biological replicates after neuronal co-culture confirm induction observed in RNA-seq data. Alternative white and light gray shaded regions align gene names with each result. This designation applies to all following figures. * p < 0.05, ** p < 0.01, *** p < 0.001 relative to naïve astrocytes using one-way t-test. Error bars show 95% confidence intervals. D) Immunofluorescence results for GCLM protein in naïve astrocytes and astrocytes co-cultured with neurons. Top, representative images, with indicated agents, scale bar, 20 µm. Bottom, box plots for cells measuring mean-normalized GCLM pixel intensities. Results shown are averages of three replicates. Upper bar is 95th percentile, and lower bar is 5th percentile. The top of each box is the 75th percentile, while the bottom is the 25th percentile. The bar within each box represents the median. **** p < 0.0001 relative to naïve astrocytes using student’s t-test. E) Immunofluorescence results using Thioltracker as a measure of glutathione levels in naïve astrocytes and astrocytes co-cultured with neurons. At top are representative images, with indicated agents, scale bar, 40 µm. Bottom, box plots as in D for cells measuring mean-normalized Thioltracker pixel intensities, n=5. **** p < 0.0001 relative to naïve astrocytes using student’s t-test.

