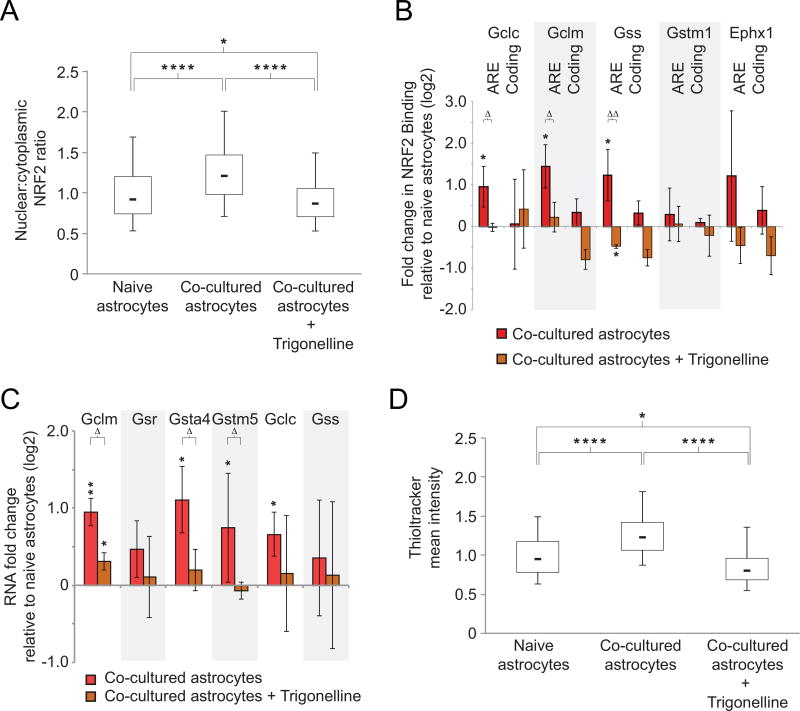
Figure 7. Blocking NRF2 activity with trigonelline eliminates neuron-induced astrocyte glutathione pathway activation.
A) Box plot as in Fig. 6B showing immunofluorescence staining for NRF2 in the nucleus relative to the cytoplasm of astrocytes when co-cultured with neurons, with and without the NRF2 inhibitor, trigonelline. * p < 0.05, **** p < 0.0001 to indicated conditions using one-way analysis of variance. B) Chromatin immunoprecipitation results for NRF2 at AREs and control coding regions following trigonelline treatment (brown bars) or untreated (red bars) (n=3). * p < 0.048, ** p < 0.01 relative to naïve astrocytes using one-way t-test; Δ p < 0.048, ΔΔ p < 0.01, ΔΔΔ p < 0.001 relative to untreated co-cultured astrocytes using student’s t-test. Error bars show 95% confidence intervals. C) qRT-PCR for glutathione metabolic genes in astrocytes co-cultured with neurons in the presence or absence of trigonelline. Values on Y-axis are fold change of RNA for astrocytes in co-culture with neurons relative to naïve astrocytes (n=3). * p < 0.048, ** p < 0.01 relative to naïve astrocytes using one-way t-test; Δ p < 0.048 relative to co-cultured astrocytes using student’s t-test. Error bars show 95% confidence intervals. D) Box plot as in Fig. 3E showing Thioltracker immunofluorescence of naïve astrocytes or astrocytes co-cultured with neurons in the presence or absence of trigonelline (n=3). * p < 0.05, **** p < 0.0001 between indicated conditions using one-way analysis of variance.

