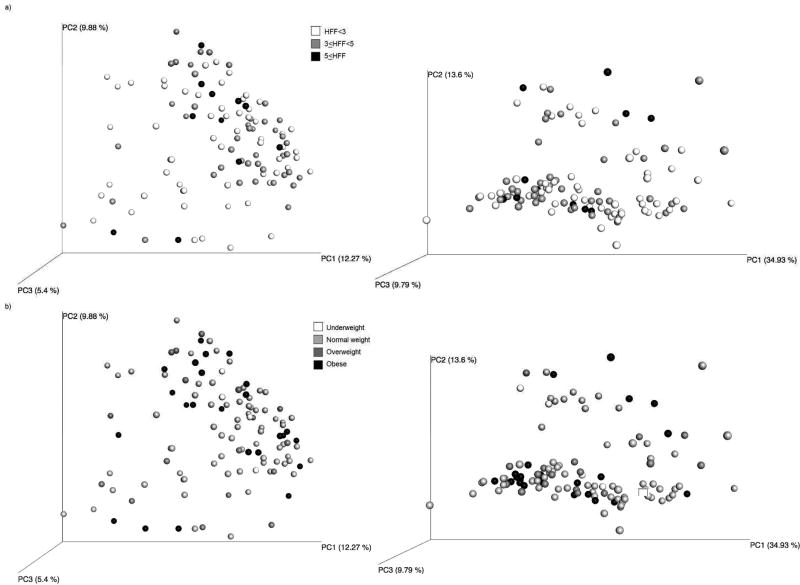
Figure 2.
Principal Coordinate Analysis plots of unweighted (left) and weighted (right) UniFrac distance by a) amount of hepatic fat fraction, and b) weight group. Statistical models showed a significant relationship between unweighted UniFrac distance and HFF (p=0.01), as well as between weighted UniFrac distance and BMI z-score (p=0.04).

