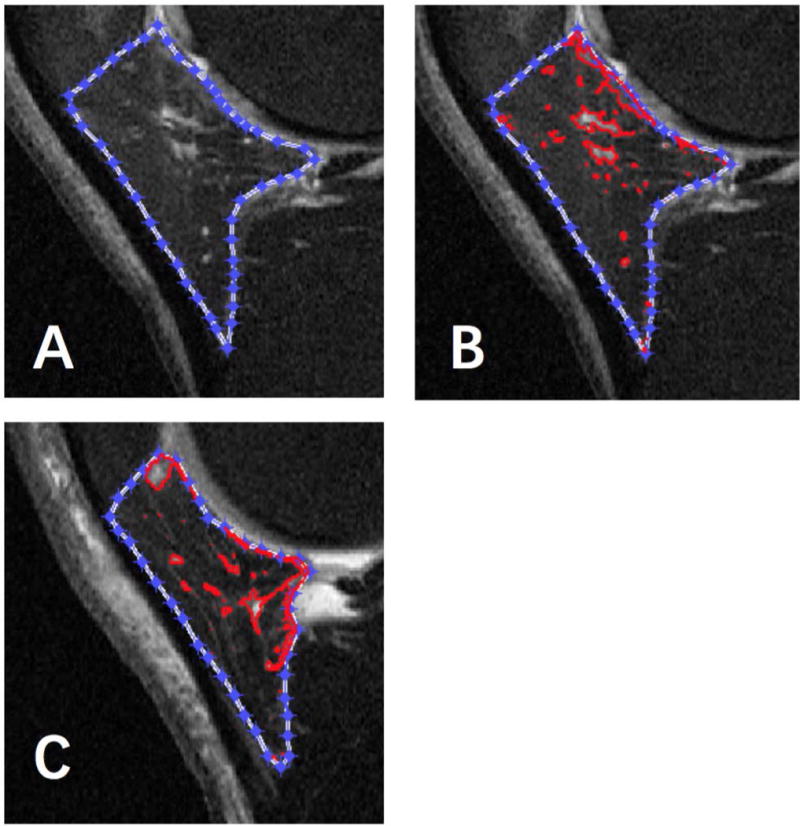
Figure 1. The segmentation of IPFP and high signal intensity measurements on sagittal T2 images using MATLAB.

(A) The outer contour of IPFP was contracted inward by software. (B) The high signal intensity region was selected automatically by red circle. (C) The clustering effect of high signal intensity regions on this image was different from image b, which had a lower clustering factor(H).
