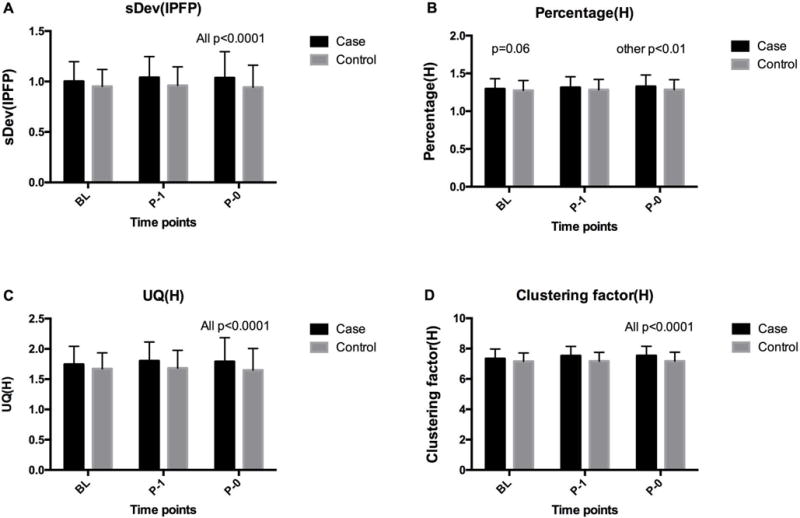
Figure 2. Comparison of major IPFP SI measures between case and control groups.

(A) sDev (IPFP), (B) Percentage (H), (C) UQ (H), (D) Clustering factor (H). P0: the visit when iROA was found on radiograph; P-1: 1 year prior to P0; BL: baseline.

(A) sDev (IPFP), (B) Percentage (H), (C) UQ (H), (D) Clustering factor (H). P0: the visit when iROA was found on radiograph; P-1: 1 year prior to P0; BL: baseline.