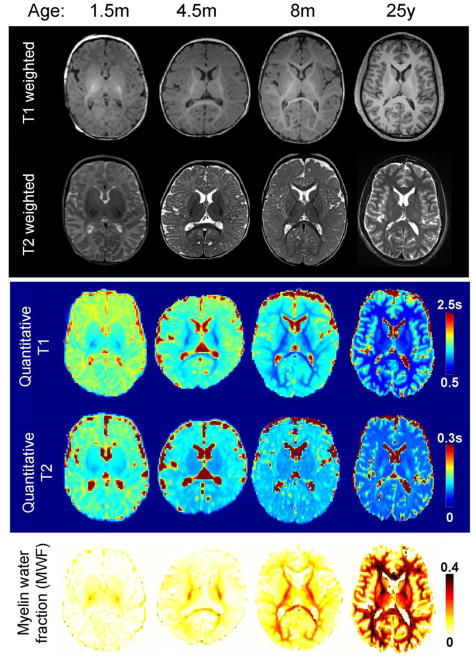
Figure 3.
Anatomical images of the developing brain. From top to bottom, T1 weighted, T2 weighted images, quantitative maps of T1, T2 relaxation times (in seconds) and myelin water fraction (MWF) of representative subjects at different ages, infant of 1.5 month (m), 4.5m and 8m and a young adult (25 years), are shown.

