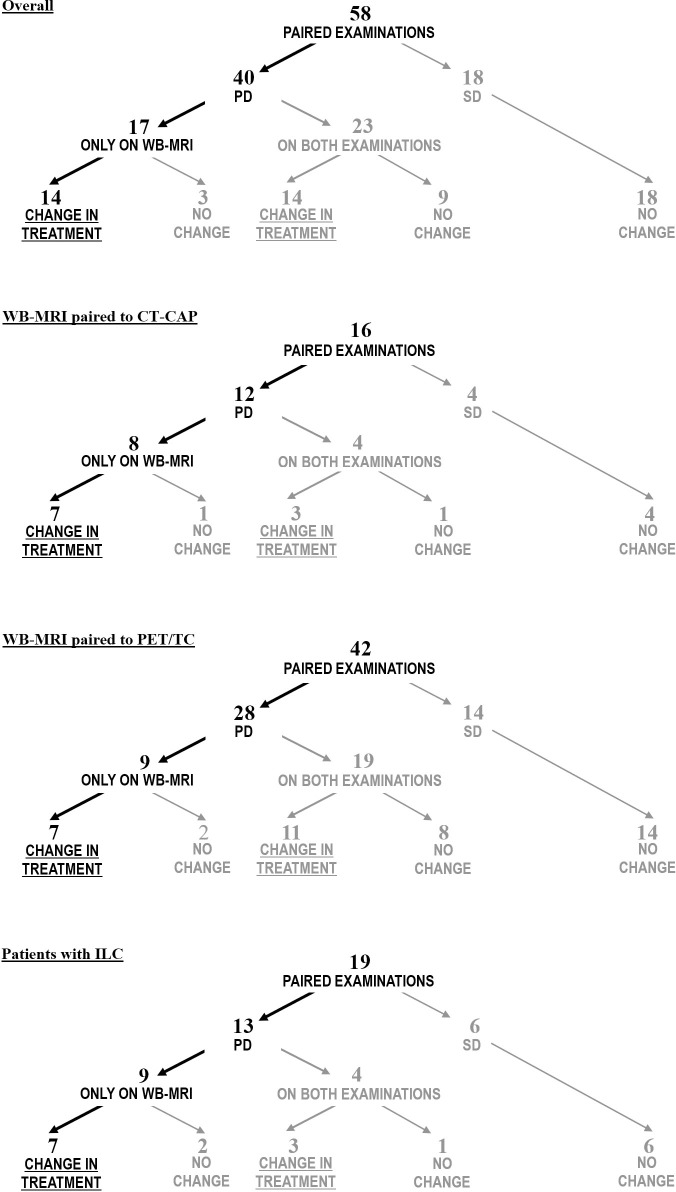
Fig 1. Impact on treatment: Overall and subgroup analyses.
The flowcharts in this picture illustrate how often the imaging outcomes motivated changes of treatment in our cohort, with a distinction between the cases of PD reported only on WB-MRI and those in which PD was reported on both examinations (WB-MRI and the control examination). The first flowchart includes all 58 paired examinations (overall analysis). Separate analyses are shown for specific subgroups in the following flowcharts, including analyses of all 16 paired examinations in which WB-MRI was paired to CT-CAP, all 42 paired examinations in which WB-MRI was paired to PET/CT and all 19 paired examinations performed in ILC patients. Abbreviations: PD = progressive disease; SD = stable disease.

