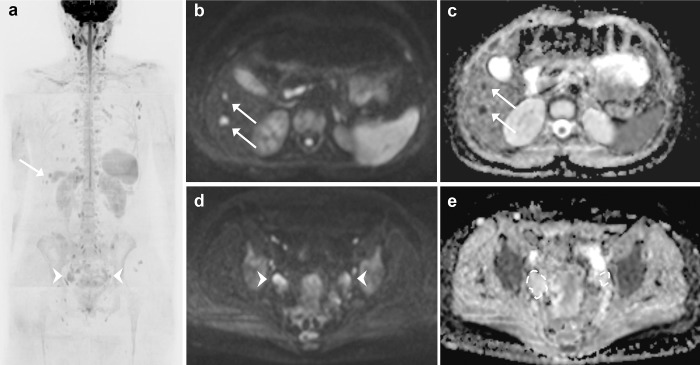
Fig 4.
In this picture, taken from the same examination of Figs 2 and 3, two different examples of high signal intensity findings in DWI b-900 MIP (a) are illustrated. (b) B-900 DWI images reveal two new hyper intense lesions in the left liver lobe (arrows). (c) In the correspondent ADC map, the lesions (arrows) show low values, which suggest high cellularity, making them suspicious for metastases. (d) B-900 DWI images show bilateral pelvic masses with high signal intensity (arrowheads). (e) The correspondent ADC maps shows the absence of impeded diffusion within the masses, that represent follicular ovarian cysts.

