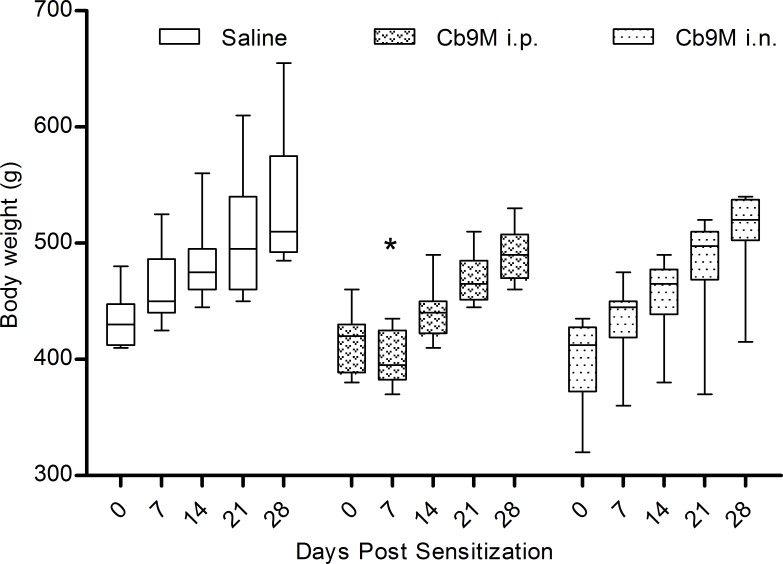
Fig 3. Weekly body weights by inoculation route.
Data are represented as group mean (n = 8) by route of exposure to C. burnetii Nine Mile (Cb9M, i.p. intraperitoneal; i.n. intranasal; saline controls). Error bars represent standard deviation; boxes denote 25th and 75th quartiles. Group mean body weights of saline and i.p. inoculated groups were statistically different at day 7 p.i. (one-way ANOVA with Tukey’s multiple comparison test; *P = 0.003).

