
Fig. 1. Heterozygosity and inbreeding in the Vindija Neandertal.
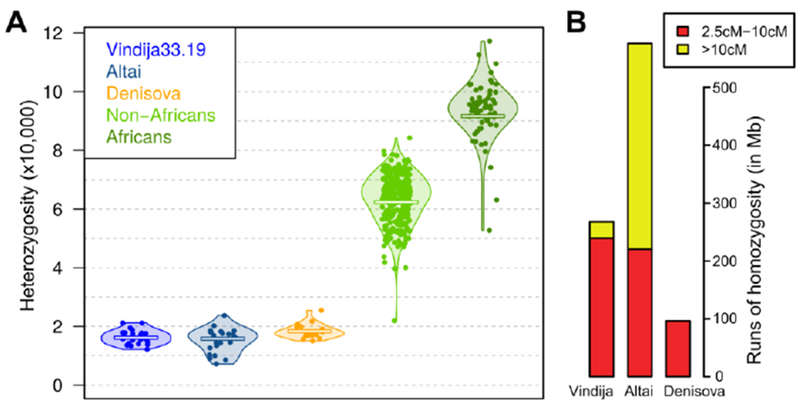
(A) Distribution of heterozygosity over all autosomes in the three archaic hominins, 12 Non-Africans and 3 Africans. Each dot represents the heterozygosity measured for one autosome. The center bar indicates the mean heterozygosity across the autosomal genome. (B) Genome covered by shorter (2.5–10cM, red) and longer (>10cM, yellow) runs of homozygosity in the three archaic hominins.