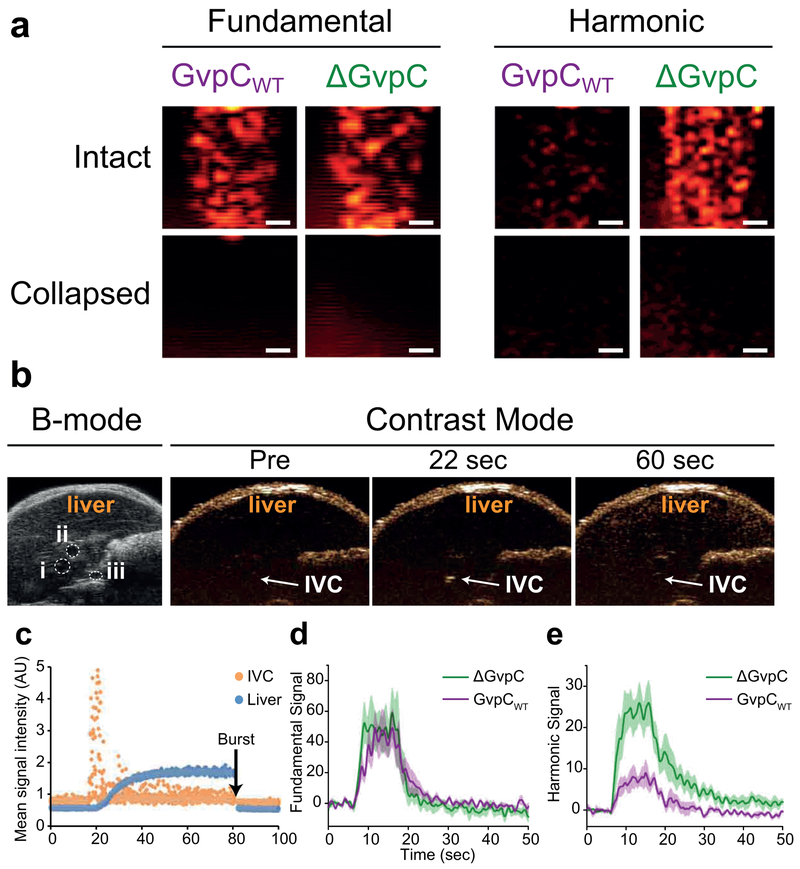
Figure 8. Anticipated results for in vitro and in vivo ultrasound imaging.
(a) Fundamental and second harmonic images for intact ΔGvpC and GvpCWT Ana GVs (top panel) acquired using the Verasonics L11–4v transducer with a 4.46 MHz transmission and band-pass filtered around 4.46 and 8.92 MHz respectively. A high power burst from the transducer is used to collapse the GVs (bottom panel). Scale bars are 1 mm. (b) B-mode image of the liver showing the (i) inferior vena cava (IVC), (ii) portal vein and (iii) abdominal aorta. Contrast mode images acquired using high-frequency ultrasound show the liver and IVC with the baseline contrast image before injection of Halo gas vesicles. Following a bolus injection of gas vesicles, contrast enhancement is seen in the IVC followed by the liver. (c) Time intensity curve depicting the nonlinear contrast signal change over time for the IVC (orange) and the liver (blue) before, during, and after an intravenous administration of Halo gas vesicles. Time intensity curve in the (d) fundamental and (e) second harmonic mode depicting the change in acoustic signal in the IVC before, during and after steady infusion with ΔGvpC and GvpCWT Ana GVs. Shaded regions represent SEM (N=6).Figures (a, d-e) adapted with permission from Lakshmanan, A. et al. Molecular Engineering of Acoustic Protein Nanostructures, ACS Nano, Copyright © 2016, American Chemical Society.

