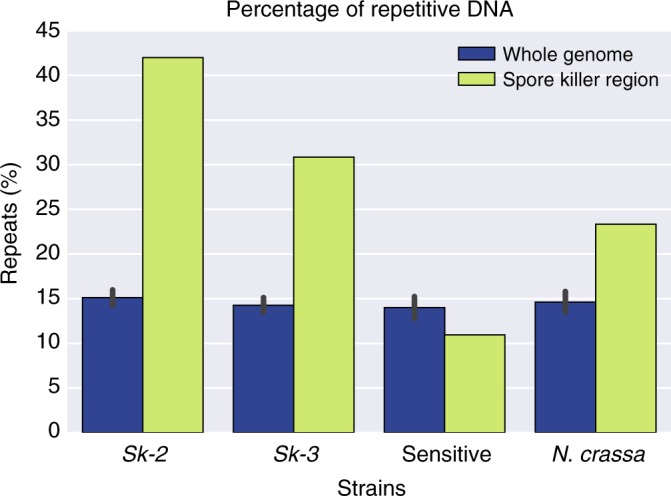
Fig. 2.

Percentage of repetitive DNA in three strains of Neurospora intermedia with different spore killer phenotypes (Sk-3: 3194; Sk-2: 7426; sensitive: 8761). Blue bars show the whole genome, and yellow bars the non-recombining spore killer region. Error bars (95% confidence intervals) for the whole-genome data were calculated using sliding windows of the same size as the spore killer region, with a step size of 200 kb. Note that no formal statistical test has been performed to determine if the repeat content in the spore killer region is significantly different from the background genome, but the data point does not overlap with the 95% confidence interval from the whole genome
