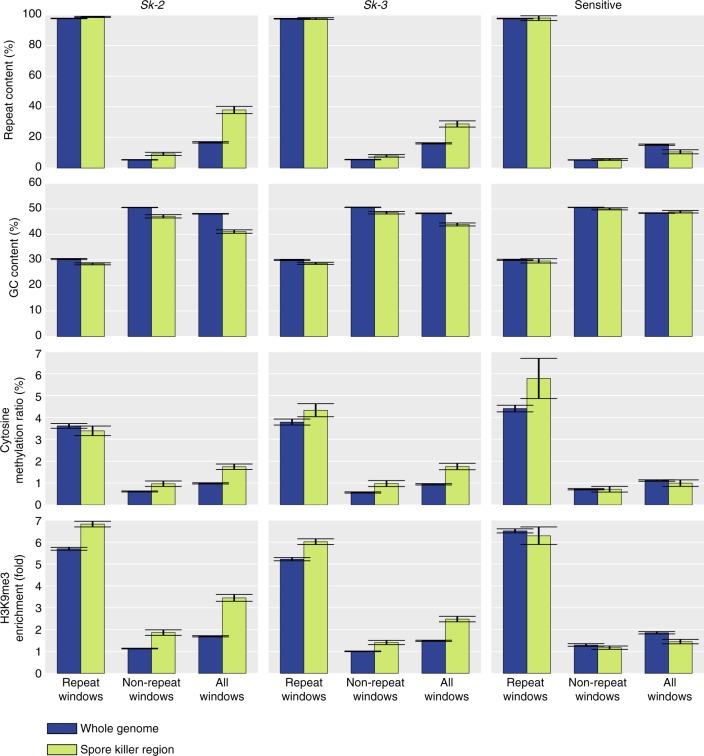
Fig. 3.
Repeat content, GC content, cytosine methylation, and H3K9me3 enrichment of the genome and the spore killer region in strains 3194 (Sk-3), 7426 (Sk-2), and 8761 (sensitive) of Neurospora intermedia. All values are calculated using 2 kb sliding windows with a step size of 2 kb. Windows consisting of >75% repetitive content are classified as “repeat windows” and those with <75% are classified as “non-repeat windows.” “Repeat content” plots indicate that most windows classified as repetitive contain close to 100% repeats, consistent with a clustered distribution of repeats. Error bars show 95% confidence intervals. GC content, cytosine methylation levels, and H3K9me3 levels are all significantly different between repeat and non-repeat windows (Student’s T test, p ≪ 0.001 for all comparisons). The Sk regions of the spore killers are also significantly different from the rest of the genome in all these characteristics, though the differences are less pronounced than when comparing repetitive and non-repetitive regions. These results are consistent with previous data from N. crassa, in which cytosine methylation and H3K9me3 histone methylation are both signatures of constitutive heterochromatin and primarily found in repetitive regions that have been mutated by the RIP mechanism, which also lowers the GC content

