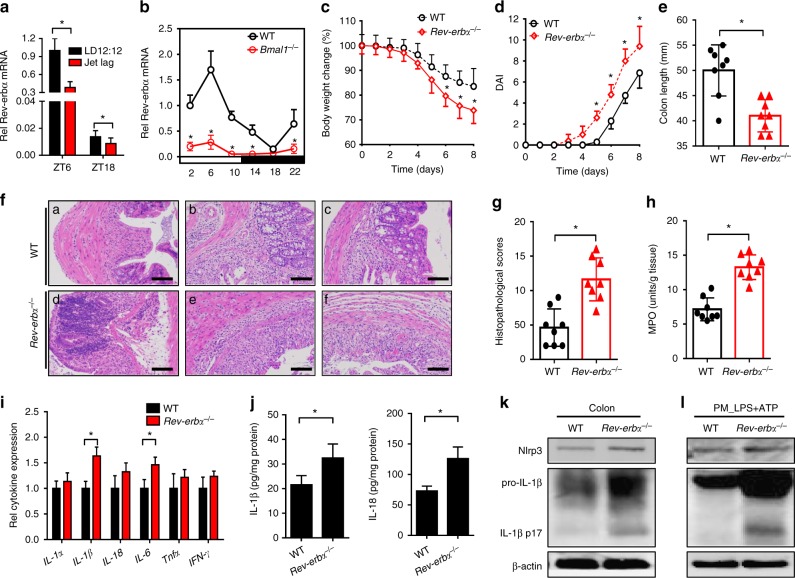
Fig. 2.
Rev-erbα ablation sensitizes mice to experimental colitis. a Circadian clock disruption by jet lag decreased Rev-erbα. Data are mean ± SD (n = 8). *P < 0.05 (t test). b Circadian clock disruption by Bmal1 deletion decreased Rev-erbα. c Weight loss measurements of wild-type (WT) and Rev-erbα−/− mice treated with DSS. d DAI scores of wild-type and Rev-erbα−/− mice treated with DSS. In panels b–d, data are mean ± SD (n = 8). *P < 0.05 versus WT at individual time points (t test). e Colon lengths of wild-type and Rev-erbα−/− mice treated with DSS. Colon length was assessed at the time of necropsy. f Representative micrographs of H&E staining in the colon. Scale bar = 100 µm. g Histopathological scores of wild-type and Rev-erbα−/− mice treated with DSS. h MPO activities of wild-type and Rev-erbα−/− mice treated with DSS on day 8. i Expressions of inflammatory cytokines in colons of WT and Rev-erbα−/− mice (2 days post DSS feeding) quantified by ELISA. Data are mean ± SD (n = 6). *P < 0.05 (t test). j ELISA measurements of colonic IL-1β or IL-18 on day 8 after DSS feeding. k Western blotting of Nlrp3, IL-1β, and β-actin in colons from WT and Rev-erbα−/− mice on day 8 after DSS feeding. l Western blotting of Nlrp3, IL-1β, and β-actin in PMs from WT and Rev-erbα−/− mice. PMs were stimulated with LPS for 8 h and ATP for the last 0.5 h. Each western blot is representative of three independent experiments (statistical differences between blot density levels were analyzed by Mann–Whitney U test, Supplementary Figure 12). For biochemical analyses, mice were sacrificed at ZT8 and colons were collected. In panels e, g, h and j, data are mean ± SD (n = 8). *P < 0.05 (t test). DAI: disease activity index, MPO: myeloperoxidase. Chemical concentrations: LPS (100 ng/ml), ATP (2 mM)

