Fig. 5.
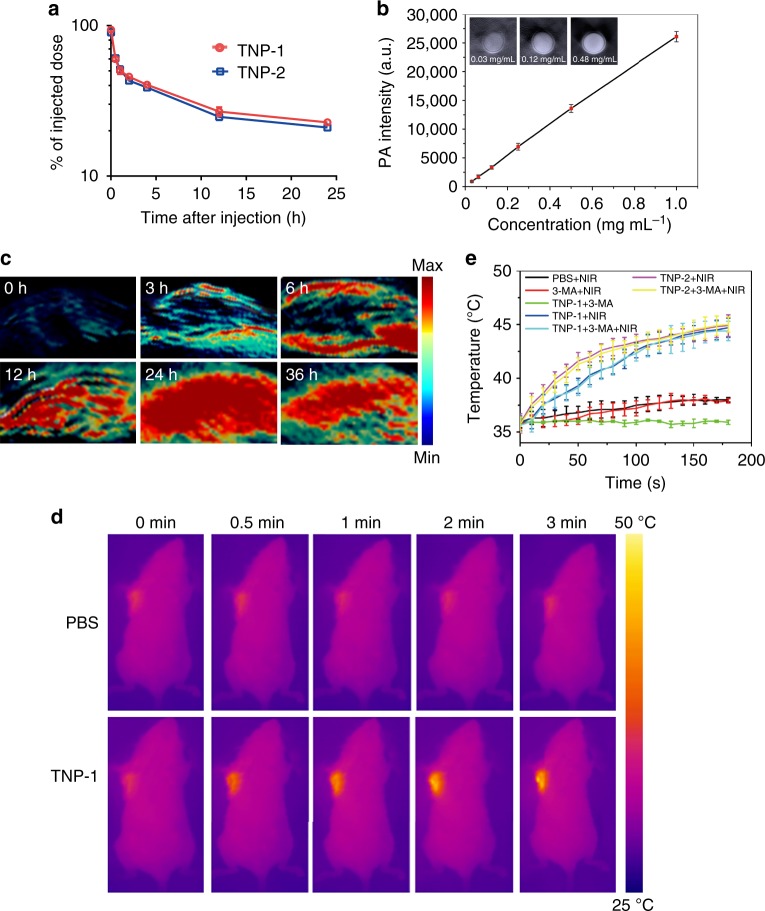
Pharmacokinetics and imaging properties of TNP-1. a Pharmacokinetic profile of TNP-1 and TNP-2. Mean ± s.e.m. n = 3. Student’s t-test. b Photoacoustic images and photoacoustic intensity of TNP-1 of different concentrations in deionized water. c In vivo photoacoustic images of the 4T1 breast tumor at different time points after intravenous injection of PBS (control) and TNP-1. d The thermographs of mice recorded while NIR irradiation for the various times, 24 h after the injection of PBS or TNP-1. e The tumor-site temperature changes recorded while NIR irradiation for the various times, 24 h after the indicated PTT treatment

