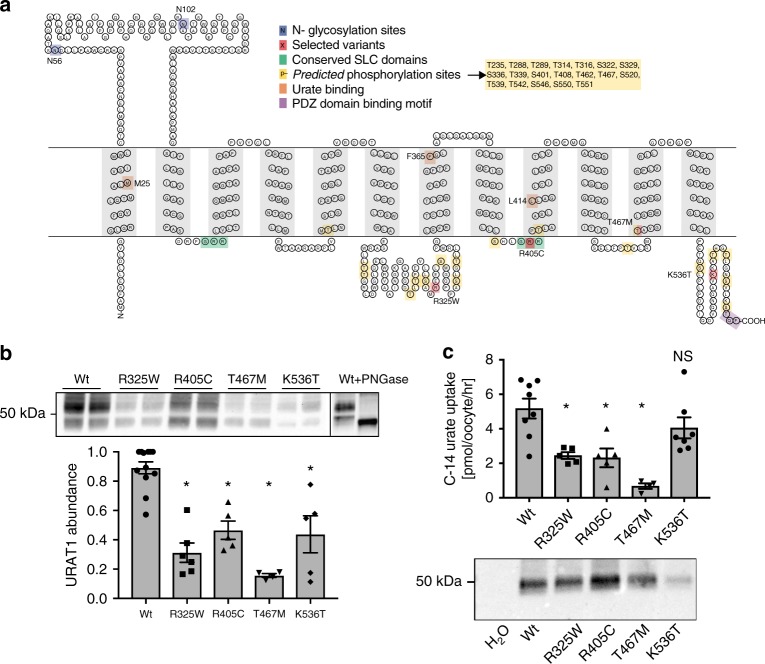
Fig. 2.
Topology and experimental results of four damaging variants in SLC22A12. a Topology of SLC22A12 gene product URAT1 with position of variants tested marked in red. Also marked are glycosylation sites (blue); conserved domains (green); predicted phosphorylation sites (see Supplementary Methods; yellow); proposed urate-binding residues (orange); and the PDZ domain binding motif (purple). b Abundance of URAT1 mutant constructs in HEK293T cells, glycosylation revealed with PNGase, and summary data; n = 4 to 12; ±SEM; *p < 0.0001 (ANOVA with Dunnett’s multiple comparison test). Each lane represents a separate experiment run, processed, and quantified in parallel. The line in the image denotes the separation between two separate blots. c Summary data from Xenopus oocytes accumulation assay using C-14 labeled urate (see methods). URAT1 mediated urate transport rates with the H2O injected control transport rate subtracted (flux of the H2O injected controls was 4.3 [pmol/oocyte/hr]); n = 10 to 16 oocytes (processed in 5 to 8 pairs); ±SEM; *p < 0.01 (ANOVA with Dunnett’s multiple comparison test). Western blot shows the total abundance of each variant upon equal mRNA injection; lysates from 4–5 pooled oocytes for each construct. Note: in Xenopus oocytes the URAT1 monomer migrates as a single band unlike what is observed in HEK293T cells

