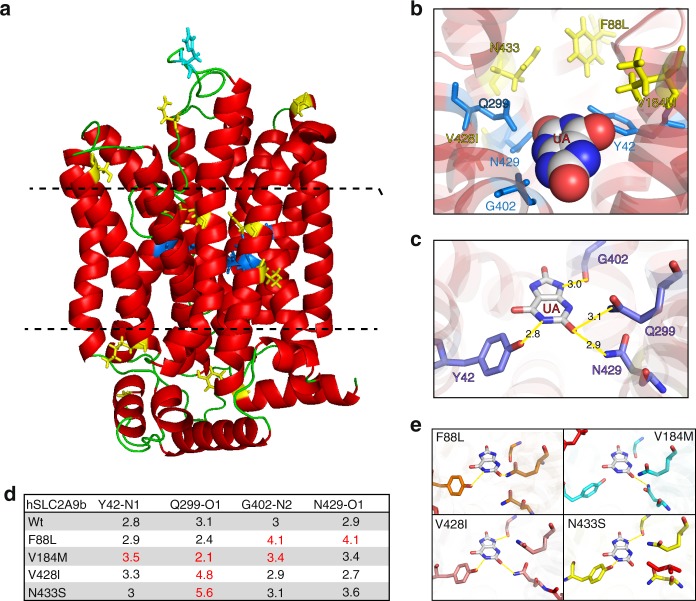
Fig. 3.
Mapping of residues to predicted model of SLC2A9b. a Model of human SLC2A9b in the outside open configuration, based on the rat SLC2A5 (GLUT5) crystal structure PDB:4YBQ (see Methods), all residues depicted are Wt residues. Yellow sticks = position of variants associated with lower serum urate (Wt residue shown), cyan = position of variants associated with higher serum urate (Wt residue shown), dark blue = residues predicted to be important in urate binding. Dashed lines define the functional zones, top is the extracellular interface, bottom is the intracellular interface and the middle is the transport core. b Visualization of the urate-binding pocket within the transporter core and the position of variants (Wt residue shown) and key urate-binding residues (Y42, Q299, G402, N429; blue). c Prediction of urate occupancy in the binding pocket and the length and position of predicted hydrogen bonds (yellow; in Angstroms). d Table of distances between critical urate interacting atoms (N, Nitrogen; O, Oxygen; see Supplementary Fig. 9) and their predicted binding partner in the presence of variant residues. Red color denotes predicted loss of hydrogen bond (PyMol polar contact prediction tool; in Angstroms). e Predicted hydrogen bonds (yellow) between urate and the residues of the binding pocket (mutant residues in red)

