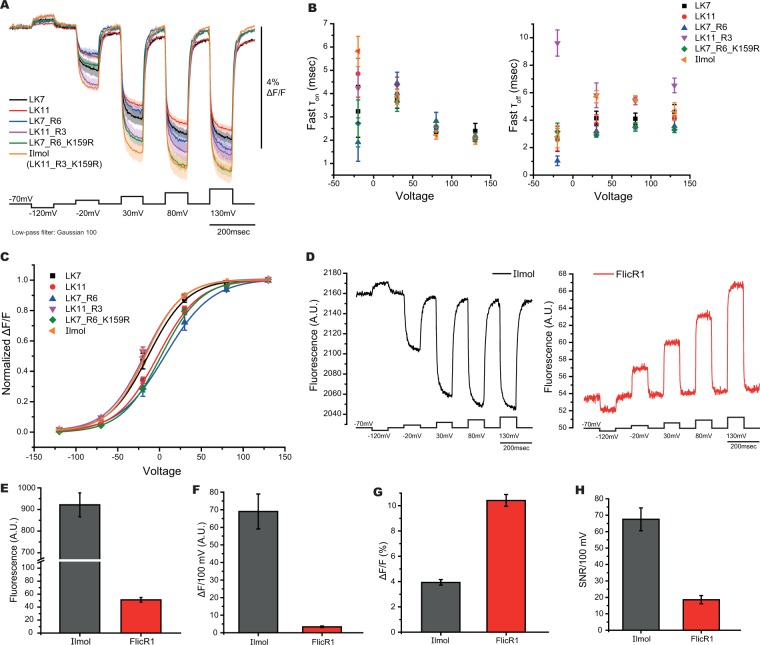
Figure 4.
Optical properties of Ilmol. (A) Optimizing multiple parameters slightly improves signal size. Traces from two linker lengths, LK7 and LK11, were compared to the optimized linker charge composition, LK7_R6 and LK11_R3, and FP mutations, LK7_R6_K159R and LK11_R3_K159R (Ilmol). (B) Time constants of constructs in A. (C) Voltage range of constructs in A. (D) Comparison of Ilmol to FlicR1. Representative traces of Ilmol (left) or FlicR1 (right) in response to voltage when expressed in HEK 293 cells. The voltage protocol was the same for both constructs (average of 16 trials). (E) Average brightness for Ilmol and FlicR1 (n > 60 for both constructs in HEK 293 cells). (F) Average change in fluorescence for Ilmol and FlicR1 per 100 mV depolarization of the plasma membrane when expressed in HEK 293 cells. (G) Average fractional fluorescence change per 100 mV. (H) SNR for 100 mV depolarization of the plasma membrane (n ≥ 4 for all constructs).

