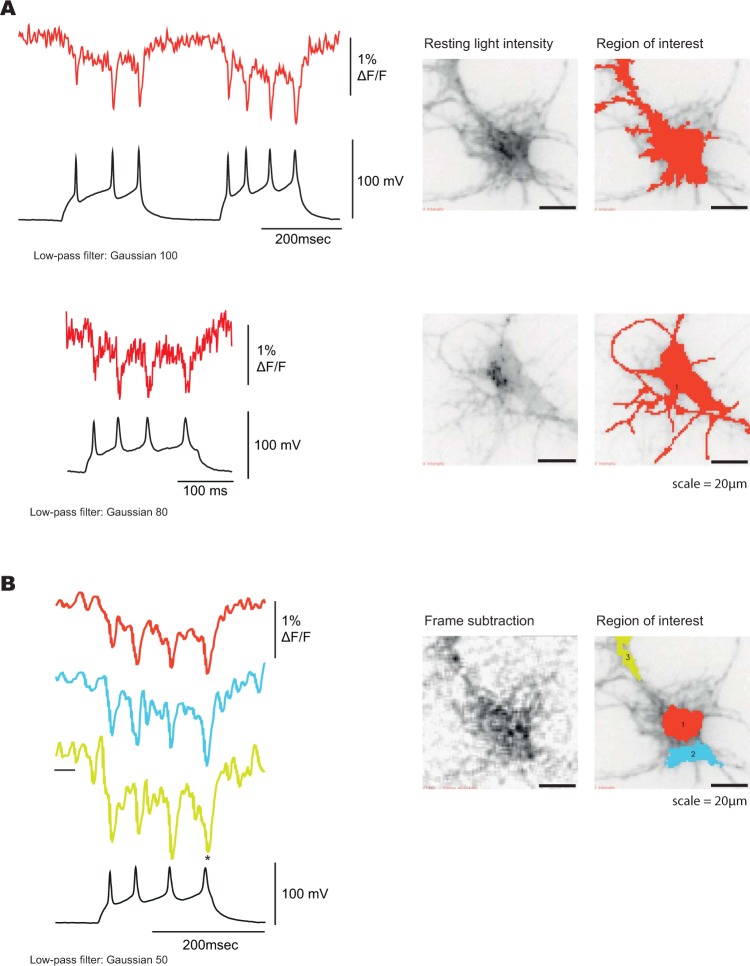
Figure 5.
Optical signal from Ilmol in response to action potentials. (A) Hippocampal neurons expressing Ilmol were imaged under current clamp. Top trace is a higher quality signal from a single trial recording at 1000 hertz yielding a 1.5% signal/action potential. Bottom trace is a lower quality signal giving a 1% signal per action potential. Corresponding neurons are shown on the right. Resting fluorescence is the grey scale image. Regions of interest generating traces on the left are shown in red. (B) Optical traces of Ilmol from different regions of a neuron (soma: red, processes: blue and yellow). The corresponding region of interest is shown on the right. Image on the left shows the changes in fluorescence during action potential. A frame subtraction image was generated by subtracting the average fluorescence of the three frames during the action potential (denoted by an asterisk) from the average fluorescence of 20 frames before the onset of action potentials (denoted by black bar below the yellow trace).

