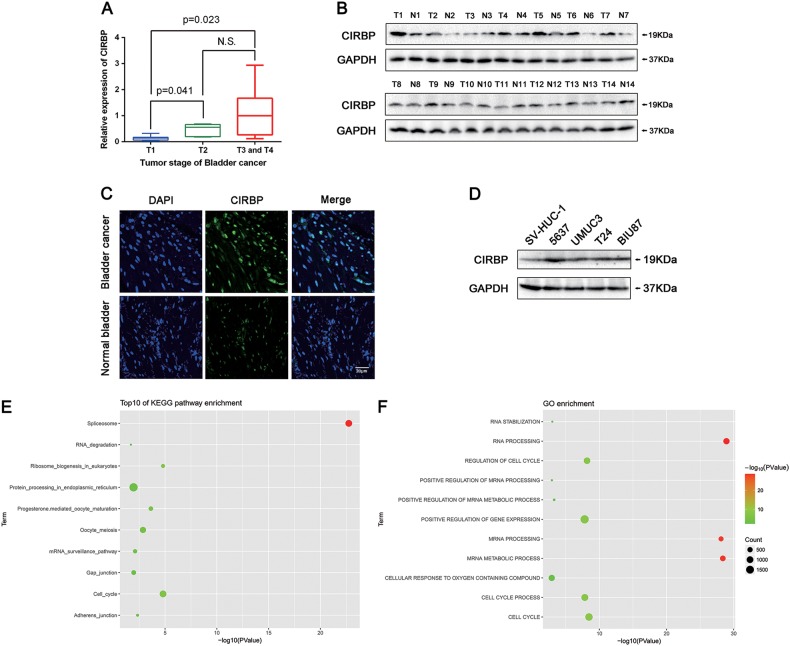
Fig. 1. CIRBP protein is upregulated in 57% (8 of 14) BCa tissues and BCa cell lines, positively correlation between CIRBP expression levels and the T stage BCa, and pathway enrichment of CIRBP.
a qRT-PCR analysis of CIRBP levels in different T stage BCa tissues. b Western blot analysis of the protein level of CIRBP in 14 pairs of BCa tissues and paracancerous tissues, GAPDH was used as a loading control. c Representative immunofluorescence staining of CIRBP (green) in the BCa tissue comparing with the normal bladder tissue, nuclei were stained by DAPI (blue). The images were photographed by Confocal microscope system. d Western blot analysis of CIRBP protein abundance in four BCa cell lines (5637, UM-UC-3, T24 and BIU-87) and immortalized normal uroepithelial cell line (SV-HUC-1). e and f KEGG pathway enrichment and GO enrichment of CIRBP in miRNA Cancer MAP database

