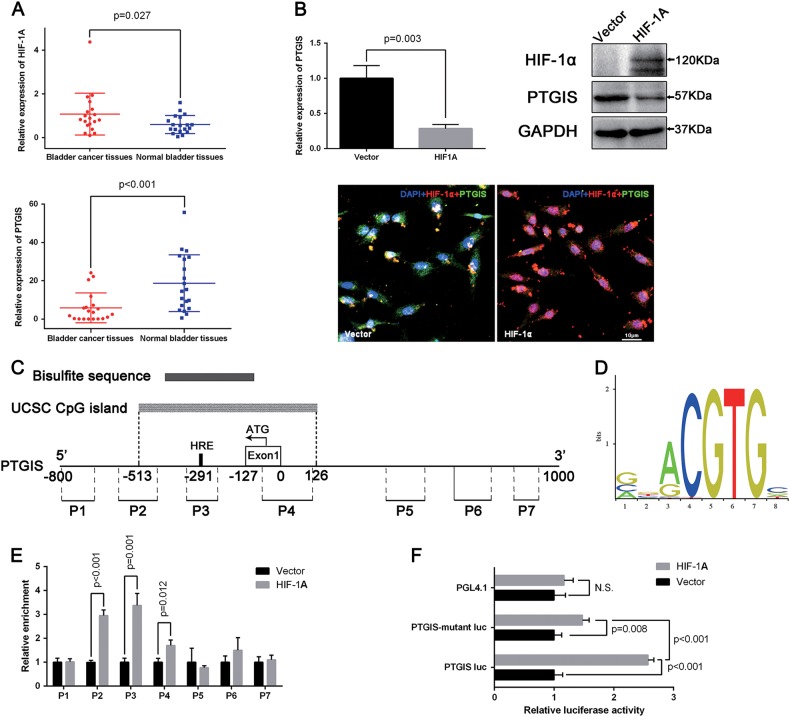
Fig. 5. HIF-1α suppresses the expression of PTGIS in BCa cells by binding to HRE sequence of the PTGIS promoter region.
a qRT-PCR analysis exhibited the expression of HIF-1A and PTGIS at the transcription level in BCa tissues compared with paracancerous tissues (n = 20). b qRT-PCR analysis, Western blot analysis and immunofluorescence staining (HIF-1α: red, PTGIS: green) for the effects on the PTGIS expression levels of HIF-1A overexpression. c The schematic representation of the PTGIS promoter region. HRE (5′-ccACGTGc-3′, −292 to −285), Exon 1 (−127 to 0), and translation start site (ATG, −72) are indicated on the genomic PTGIS sequence. The gray box represents the UCSC CpG island (−513 to 126) of PTGIS promotor region, the black box represents the bisulfite sequence region (−422 to −166) of CpG island. The thick truncated lines (P1-P7) mark the regions covered by primer sets of CHIP PCR. d The binding site of HIF-1α provided by the JASPAR database. e The ChIP assay was conducted to analyze the local enrichment of FLAG-tagged HIF-1α across the PTGIS promote region in FLAG-tagged HIF-1A transfected UMUC3 cells compared with empty vector transfected UMUC3 cells. The relative fold enrichment was quantified by normalization to input first, then normalized to empty vector transfected UMUC3 cells, which is set at 1. f Luciferase assay in UM-UC-3 cells co-transfected with PTGIS luciferase reporter plasmids (pGL4.10-PTGIS luciferase vector, pGL4.10-PTGIS HRE mutant luciferase vector or pGL4.10 base vector), and HIF-1A overexpression plasmid or empty vector. Values represent the mean ± SD of three independent experiments

