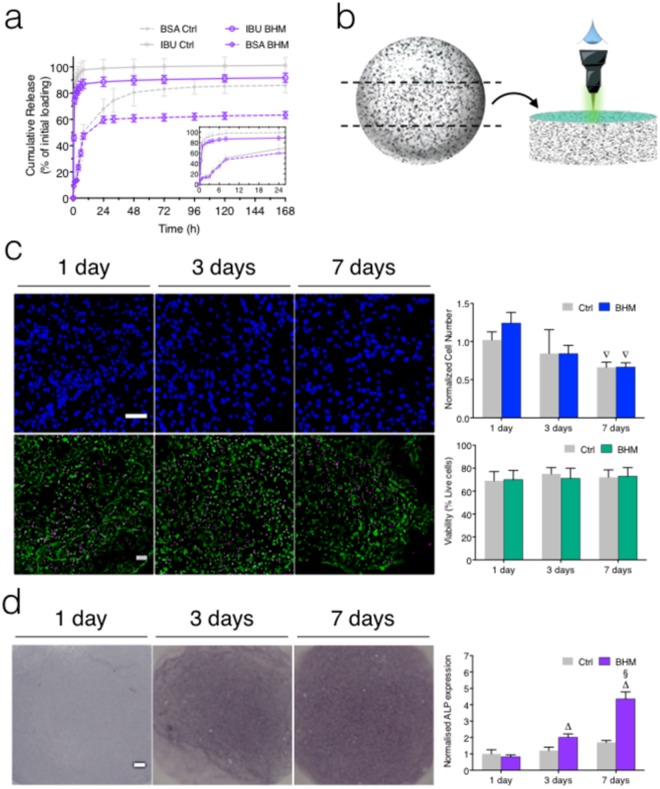
Figure 4.
Biological functional performance of the produced bioactive hydrogel marbles and the comparison with non-coated hydrogel spheres (Ctrl). (a) BSA and Ibuprofen accumulative release profiles from the constructs. The inset graphic amplifies the release profiles in the first 24 hours. (b) Slice of the BHM for core imaging purposes to eliminate the shell artifacts. (c) DAPI (on top) and live-dead (at the bottom) fluorescent microscopy images (blue represents nuclei, green represents live cells, and magenta represents dead cells) of MC3T3-E1 cells. Scale bar = 100 µm. The corresponding quantification by image analysis is also shown. The images of non-coated hydrogels (Ctrl) are presented in Fig. S7. (d) Evaluation of the early osteogenic commitment with representative images of ALP staining during the cell culture time and the respective image analysis quantification. Scale bar = 100 µm. When applicable the results are presented as the arithmetic mean ± standard deviation. The images of non-coated hydrogels (Ctrl) are presented in Fig. S8.

