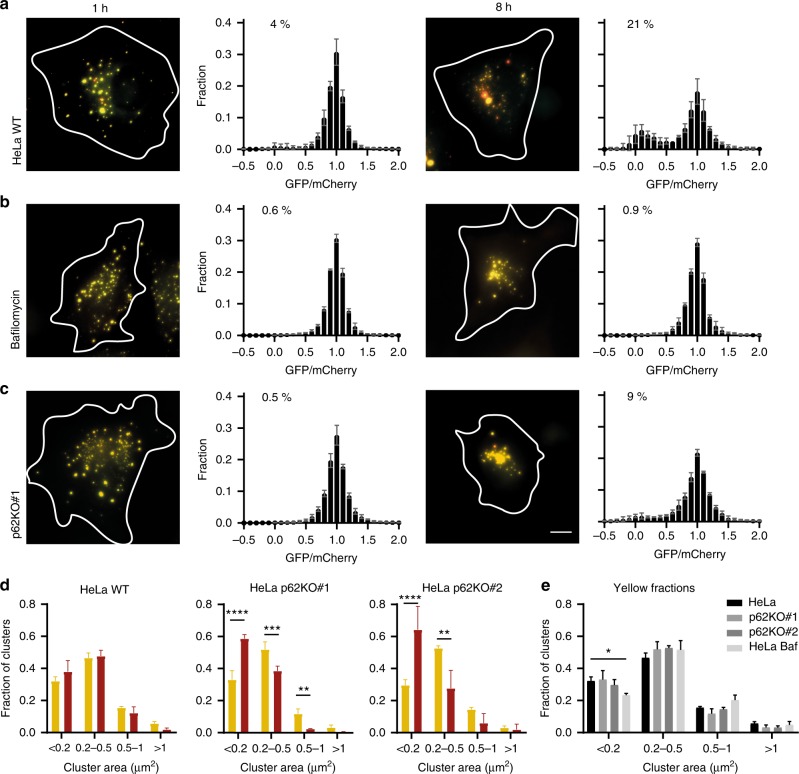
Fig. 3.
Cluster degradation at different time points. Distribution of normalized EGFP/mCherry ratios of clusters at different time points after cluster formation in a HeLa WT cells treated with 0.2% DMSO, b HeLa WT cells treated with 200 nM Bafilomycin A1, and c HeLa p62KO#1 cells. Each histogram represents >3000 clusters. Mean ± s.e.m from 3 independent experiments with 40–60 cells per condition. Percentage of red clusters is indicated as the average fraction of clusters with an EGFP/mCherry ratio <0.3 of 3 independent experiments. d Size distribution of clusters analyzed in a–c and Fig. S5. Indicated are the fraction of EGFP- and mCherry-positive clusters (yellow, ratio EGFP/mCherry >0.3) and mCherry-positive clusters (red, EGFP/mCherry <0.3) that belong to different size categories. Data are expressed as mean ± s.d. (n = 3). **P ≤ 0.01, ***P ≤ 0.001 ****P ≤ 0.0001 (one-way ANOVA with Sidak’s post-hoc test). e Size distribution of yellow clusters analyzed in a–c and Fig S5a. Data are expressed as mean ± s.d. (n = 3). *P ≤ 0.05 (one-way ANOVA with Dunnett’s post-hoc test). Scale bar 10 µm

