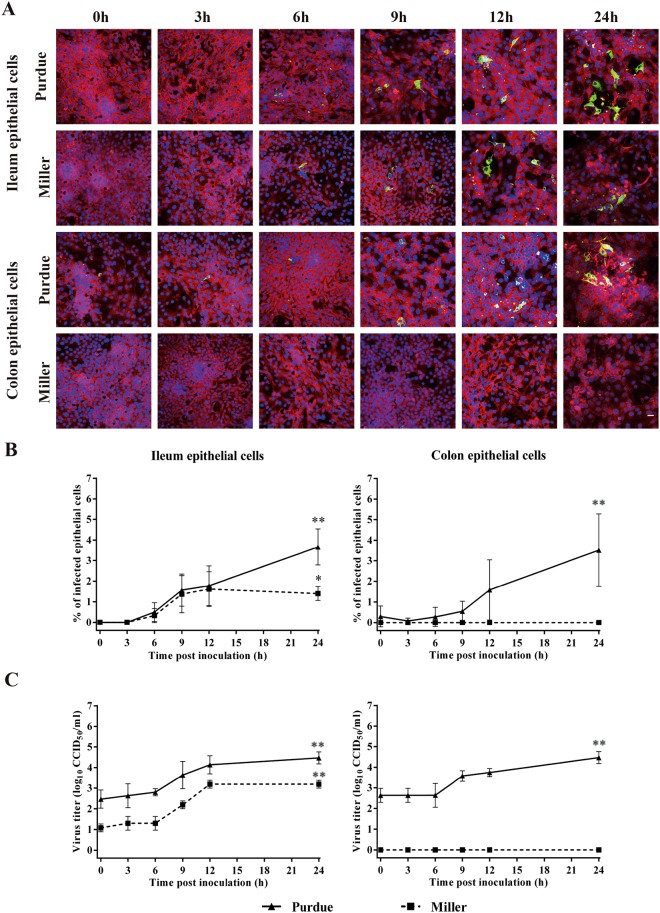
Figure 8.
Kinetics of TGEV replication in ileum and colon epithelial cells co-cultured with myofibroblasts. Three days post co-cultivation, cells were inoculated with TGEV strains Purdue and Miller at an m.o.i. = 1. At different time points post inoculation, (A) infected cells were visualized by immunofluorescence staining (red represents cytokeratin and green represents TGEV antigen positive cells) and (B) the percentage of infected epithelial cells and (C) virus titers in the supernatant were determined. Scale bar: 25 µm. Data are expressed as mean ± standard deviation of the results of 3 separate experiments. Statistically significant differences in comparison with the data from 0 h p.i. are represented as *P <0.05 or **P <0.01.

