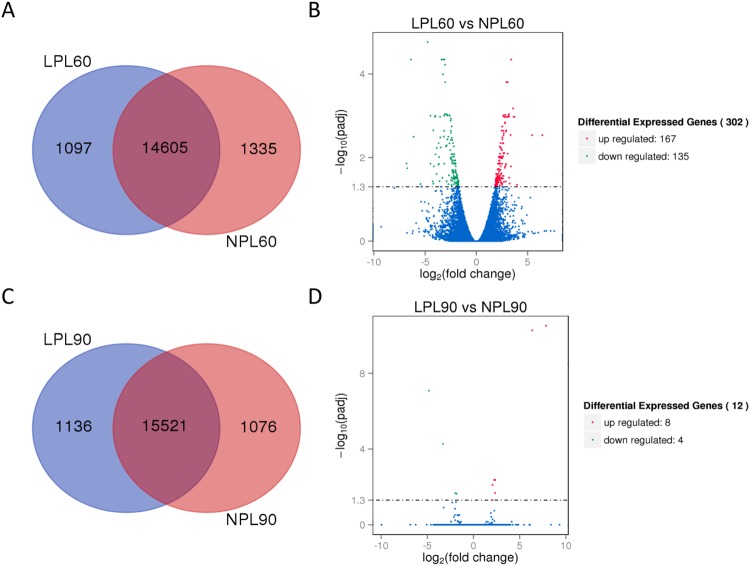
Figure 1.
Gene expression in LPL and NPL groups at 60 and 90d. (A,C) Venn diagram showing genes only expressed in the LPL group (blue circle), only expressed in the NPL group (yellow circle), and common to both groups (intersection). (B,D) Different expressed genes between the LPL and NPL groups. The red points indicated significantly up-regulated expressed genes and the green points indicated significantly down-regulated expressed genes of LPL group. The blue points indicated that no significant difference of gene expression was found between the two groups.

