Fig. 5.
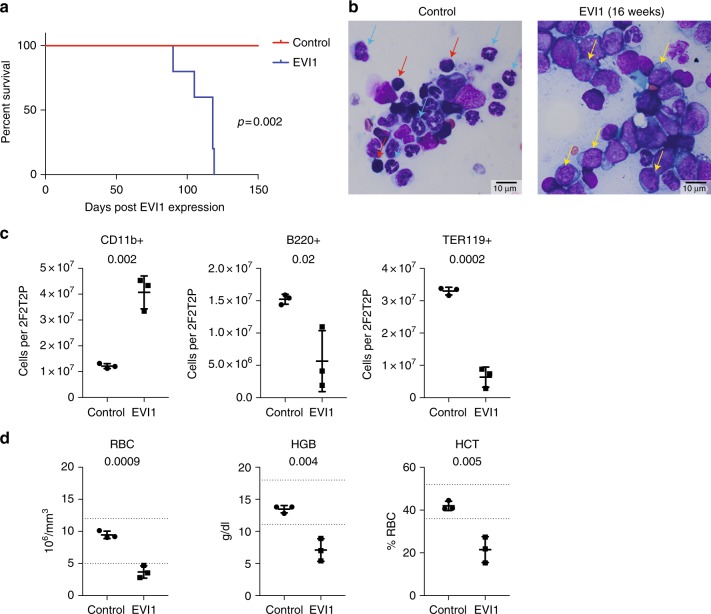
EVI1 overexpression results in AML with intermediate latency. a Kaplan–Meier curve showing survival of CD45.1 mice that were transplanted with WT:Evi1TO/TO, R26RrtTA/rtTA at a 1:1 ratio with and without DOX induction. Mice were harvested when morbidity presented (survival range = 90–119 days, median = 118 days, n = 5) b Representative Wright-Giemsa-stained bone marrow brush smears from CD45.1 mice that were transplanted with WT:Evi1TO/TO, R26RrtTA/rtTA at a 1:1 ratio without (left) or with (right) DOX induction at the day of harvest. Mice were harvested when morbidity presented. Blue arrows, maturing myeloid forms (metamyelocytes and bands); red arrows, erythroblasts; yellow arrows, leukemic blasts (scale bars: 10 μm). c Quantification of CD11b+ cells (left), B220+ cells (middle), or TER119+ cells (right) using flow cytometry analysis on WBM of CD45.1 mice that were transplanted with WT:Evi1TO/TO, R26RrtTA/rtTA at a 1:1 ratio with and without DOX induction at the day of harvest. Mice were harvested when morbidity presented (n = 3). d Quantification of red blood cells (RBC), hemoglobin (HGB), and hematocrit (HCT) using complete blood count assay performed on PB from CD45.1 mice that were transplanted with WT:Evi1TO/TO, R26RrtTA/rtTA at a 1:1 ratio with and without DOX induction at the day of harvest. Mice were harvested when morbidity presented (n = 3). For all panels, error bars represent standard deviation; p values calculated with Student’s t-test

