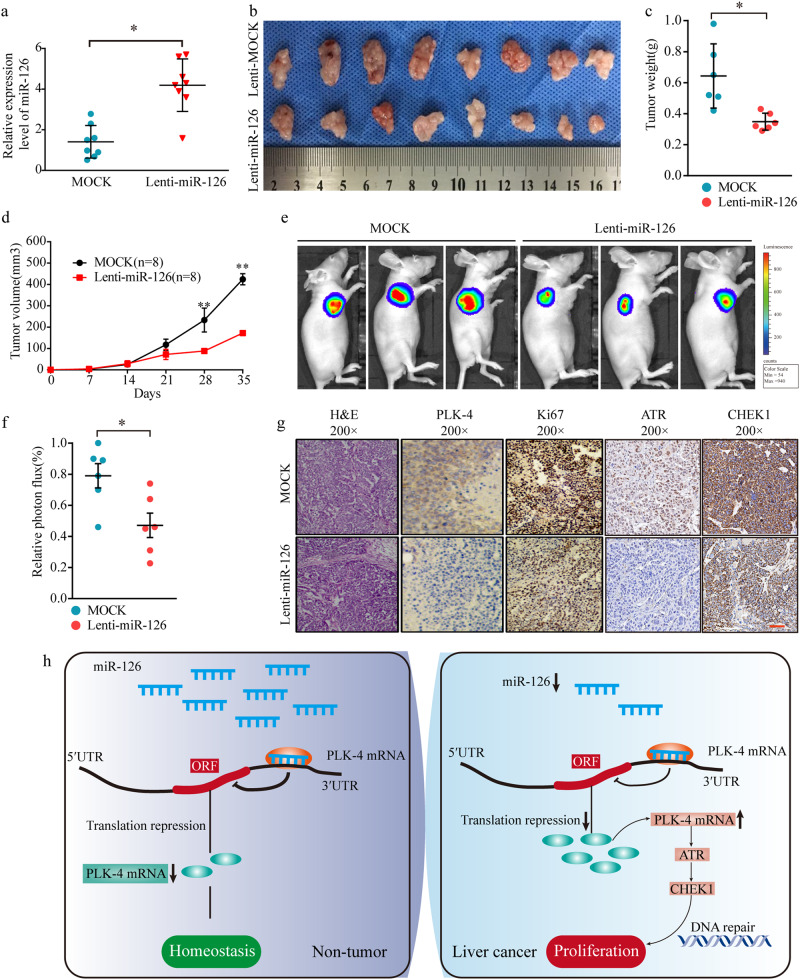
Fig. 7. In vivo functional analysis of miR-126 in HCC.
a Confirmation of miR-126 expression level in mock and miR-126 infected SMMC-7721 cells. Representative tumor images in a xenograft tumor mice model using the SMMC-7721 stable cell line expressing miR-126. b. Comparison of tumor weight (c) and volume (d) in mock and miR-126 infected SMMC-7721 cells. e Representative photographs of the xenograft tumor mice model at 4 weeks after the injection of HCC cells were taken by an IVIS system. f The strength of the luciferase signal of xenograft tumor was decreased by miR-126 overexpression. g PLK-4, Ki-67, ATR and CHEK1 staining of tumor tissues from mice inoculated with mock and miR-126 infected SMMC-7721 cells Mean ± SD, *P < 0.05, **P < 0.01, unpaired Student’s t test or one-way ANNOVA followed by multiple t test. Scale bars = 100 μm. h Schematic representation showing miR-126/PLK-4 axis mediated aggressive behaviors in HCC through activating ATR/CHEK1 signaling pathway

