Fig. 1.
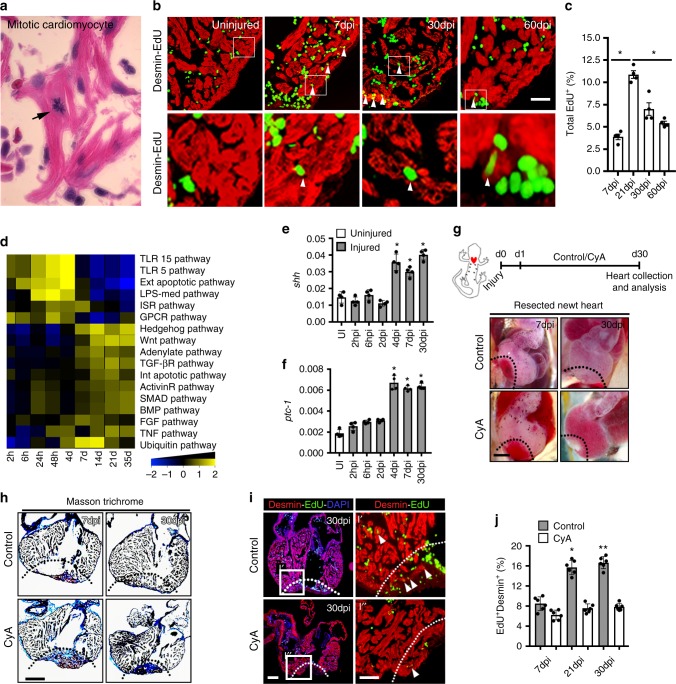
HH signaling is essential for heart regeneration. a Histological examination of the regenerating newt heart showing a mitotic cardiomyocyte in the injured tissue. b, c Immunohistochemical (b) and quantitative analysis of the total EdU+ cells (c) in the regenerating newt heart. The white arrowheads indicate the proliferating cardiomyocytes within the myocardium at specified time periods following injury. The boxed regions are magnified in the lower panels. Quantitative analysis represents counts from four randomly selected fields at 20× magnification from four replicates at each time period. d Gene set enrichment analysis using Bootstrap tools from regenerating newt heart tissue at the designated time periods postinjury. The color scale indicates the scaled expression levels of signaling pathways following heart injury. e, f qPCR analysis for shh and ptc-1 transcripts during cardiac regeneration in the newt (n = 4). g Schematic (top) of experimental protocol and whole-mount images of the regenerating heart obtained from control- and CyA-treated newts at 7 dpi and 30 dpi (n = 8 for each group). The dotted line represents the injured region of the heart. h Masson Trichrome staining of the regenerating hearts from control- and CyA-treated newts at 7 dpi and 30 dpi (n = 8 for each group). The dotted line represents the injured region of the heart. i, j Immunohistochemical staining (i) and quantification (j) of Desmin+-EdU+ cardiomyocytes in the regenerating heart from control- and CyA-treated newts at the designated time periods following injury (n = 6). The dotted line in panel i represents the injured region of the heart and the tissue in the boxed region is magnified in I′ and I″ panels. White arrowheads indicate the EdU+-cardiomyocytes. Data are presented as mean ± SEM (*p < 0.05; **p < 0.01) (see also Supplementary Figs 1 and 2) and scale bars = 200 μm (panels a, b, h, i) and 500 μm (panel g). Statistical tests were done using two-tailed unpaired Student’s t-test and one-way ANOVA

