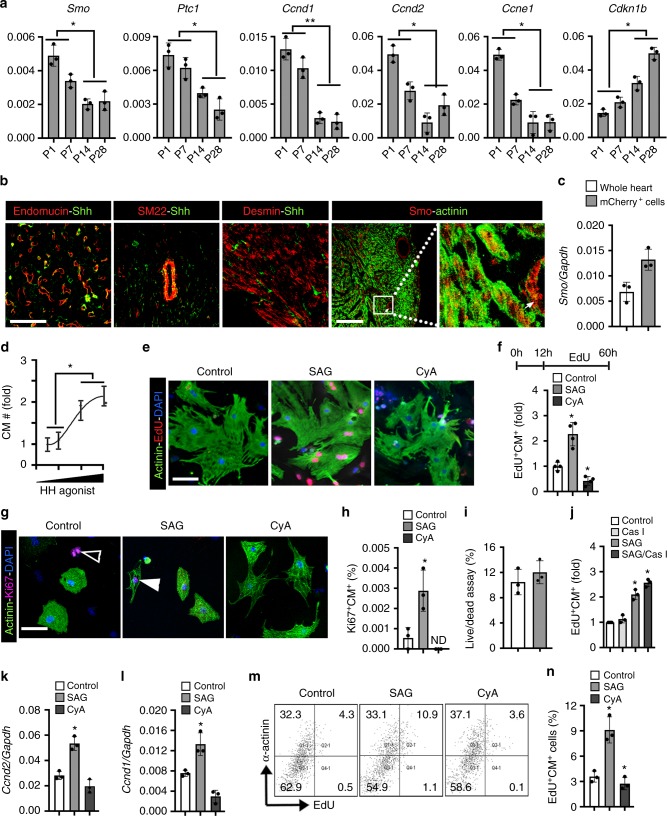
Fig. 2.
HH signaling regulates proliferation in mouse neonatal cardiomyocytes. a qPCR analysis of Smo, Ptc1, Ccnd1, Ccnd2, Ccne1, and Cdkn1b (p27) transcripts using RNA isolated from P1-P28 mouse heart tissue (n = 3 for each time point). b Immunostaining of Shh and Smo proteins with Endomucin (endothelial), SM22 (smooth muscle), Desmin (cardiomyocytes), and α-Actinin (cardiomyocytes) in P1 mouse heart sections. The boxed region is magnified in the right panel. The white arrow indicates the staining of Smo in the vascular structure. Note the punctate staining of Smo in the cardiomyocytes. c qPCR analysis for Smoothened transcripts using RNA isolated from whole heart and FACS-sorted αMHC-mCherry+ cells (a transgenic cardiomyocyte-specific promoter driving mCherry expression) from P1–P2 pooled hearts. d Quantitative analysis of cultured neonatal cardiomyocytes following treatment with various concentration of SAG. e, f Immunohistochemical images (e) and quantification (f) of α-Actinin+-EdU+ isolated neonatal cardiomyocytes following exposure to control (white bar), SAG (gray bar), or CyA (dark gray bar) and pulsed with EdU. Quantitative analysis represents the counting of four different fields at 10× from four replicates (n = 2000 cardiomyocytes for each condition). g, h Immunohistochemical images (g) and quantification (h) of α-Actinin+-Ki67+ isolated neonatal cardiomyocytes following exposure to control (white bar), SAG (gray bar), or CyA (dark gray bar). Quantitative analysis represents the counting of three different fields at 10× from three replicates (n = 2000 cardiomyocytes for each condition). Open arrowhead indicate non-cardiomyocytes and closed arrowhead cardiomyocyte positive for Ki67 protein. i Live/Dead assay using the isolated neonatal cardiomyocytes following exposure to control (white bar) and SAG (gray bar). Quantitative analysis represents the counting of three different fields at 10× from three replicates. j Quantification of α-Actinin+-EdU+ isolated neonatal cardiomyocytes following exposure to DMSO (Control), pan-caspase inhibitor (Cas I), SAG and (SAG+Cas I) for a 48 h period. Quantitative analysis represents the counting of eight different fields at 10× from three replicates. k, l qPCR analysis for Ccnd2 and Ccnd1 transcripts from isolated neonatal cardiomyocytes exposed to DMSO, SAG or CyA. m, n FACS analysis (m) and quantification (n) for α-Actinin+-EdU+ cardiomyocytes in control (white bar), SAG (gray bars) and CyA (dark gray bars) treated conditions. Quantification involved the analysis of cardiomyocytes (n = 30,000) from three replicates. Data are presented as mean ± SEM (*p < 0.05; **p < 0.01) (see also Supplementary Fig. 3) and scale bars = 100 μm. Statistical tests were done using two-tailed unpaired Student’s t-test

