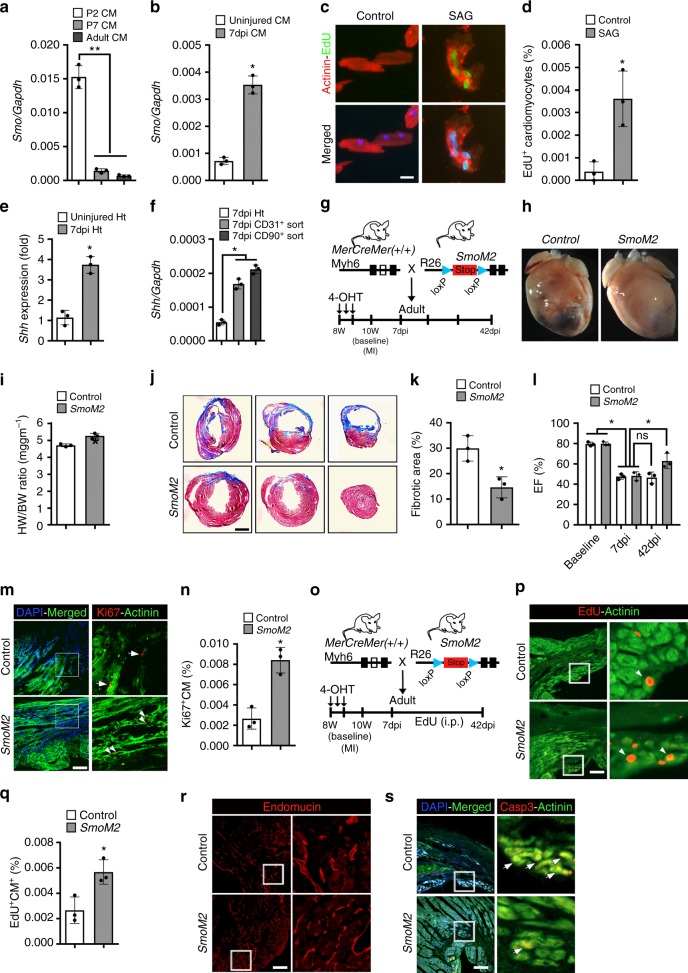
Fig. 7.
Constitutively active Smoothened mutant (SmoM2) promotes adult heart regeneration. a qPCR analysis of Smoothened (Smo) transcripts using RNA obtained from isolated cardiomyocytes at P2, P7, and P60 mouse hearts (n = 3 for each time period). b qPCR analysis of Smoothened (Smo) transcripts using RNA obtained from isolated cardiomyocytes from adult uninjured and injured heart tissue at 7 dpi (n = 3 for each sample). c, d Immunohistochemical images (c) and quantification (d) of α-Actinin+-EdU+ isolated adult cardiomyocytes following exposure to control (white bar) and SAG (gray bar) and pulsed with EdU. Quantitative analysis represents the counting of four different fields at 10× from three replicates (n = 1500 cardiomyocytes for each condition). e qPCR analysis of Shh transcripts using RNA obtained from adult uninjured and injured heart tissue at 7 dpi (n = 3). f qPCR analysis of Shh transcripts using RNA obtained from adult injured heart tissue, FACS-sorted CD31+ and CD90+ cells at 7 days post-MI (n = 3). g Schematic outlining the experimental design for Smo activation (SmoM2) and cardiac regeneration analysis following myocardial injury. h Whole-mount images of representative control and SmoM2 hearts following MI. Control mice were injected with corn oil. i Heart weight to body weight (HW/BW) ratio in control and SmoM2 adult mice at 42 dpi (n = 3 for each group). j, k Masson trichrome staining (j) and fibrotic area quantification (k) of representative heart sections at 42 days postinjury from control and SmoM2 hearts. l Time series echocardiographic measurement of ejection fraction (EF%) of control and SmoM2 mice following MI (n = 3 per group). m, n Immunostaining (m) and quantification (n) of α-Actinin+-Ki67+ cardiomyocytes in control and SmoM2 hearts. Arrowheads indicate Ki67+ labeled cardiomyocytes and arrows indicate Ki67+ labeled non-cardiomyocytes. Quantitative analysis represents counting three different fields at 20× magnification. The boxed region is magnified and shown in the right panel. o Schematic outlining the EdU-pulse experiment and cardiac regeneration analysis following myocardial injury. p, q Immunostaining (p) and quantification (q) of Actinin+-EdU+ cardiomyocytes in control and SmoM2 hearts. Arrowheads indicate EdU labeled cardiomyocytes. Quantitative analysis represents counting three different fields at 20× magnification near the injured area. The boxed region is magnified and shown in the right panel. r Immunostaining of control and SmoM2-expressing heart tissue sections using endomucin antibodies at 42 dpi. The boxed region is magnified and shown in the right panel. s Immunostaining of control and SmoM2-expressing heart tissue sections using α-Actinin and cleaved caspase-3 antibodies at 42 dpi. The white arrows indicate α-Actinin+-caspase-3+ cardiomyocytes. The boxed region is magnified and shown in the right panel. Data are presented as mean ± SEM (*p < 0.05) and scale bars = 100 μm. Statistical tests were done using two-tailed unpaired Student’s t-test and one-way ANOVA

