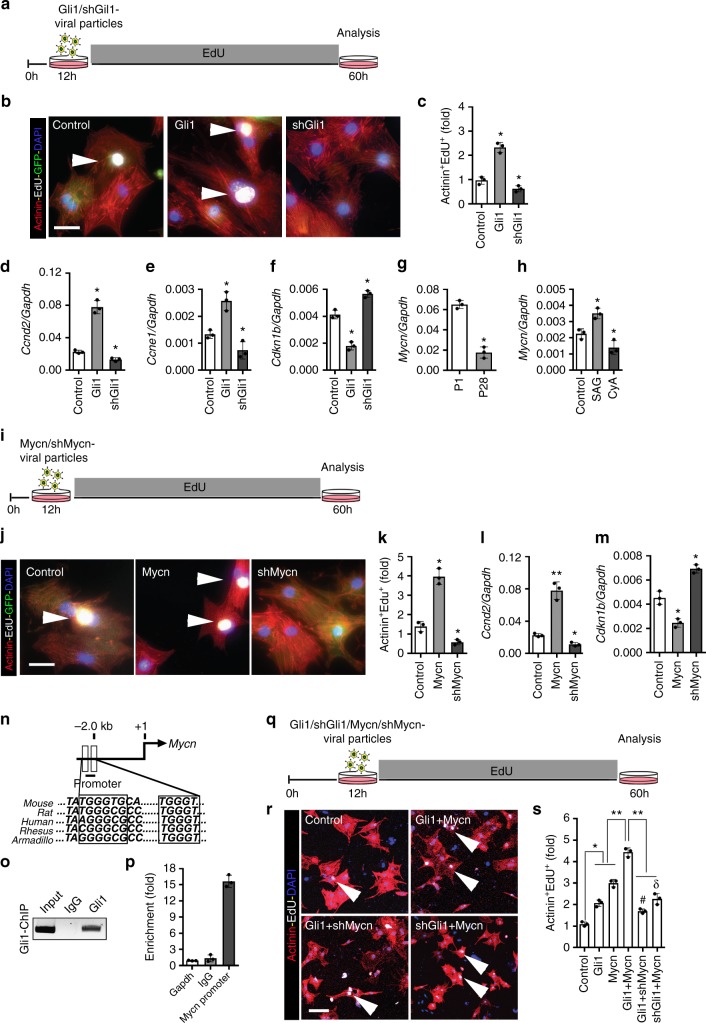
Fig. 8.
HH-Gli1-Mycn network regulates cardiomyocyte proliferation. a Schematic of Gli1 overexpression and knockdown experiments in the neonatal cardiomyocytes. b, c Immunostaining (b) and quantification of α-Actinin+-EdU+ cells (c) from control, Gli1, and shGli1 lentiviral infected cardiomyocytes. Quantitative analysis represents counting from four randomly selected fields at 10× magnification from three biological replicates. d–f qPCR analysis of Ccnd2, Ccne1, and Cdkn1b (p27) following lentiviral Gli1 overexpression or knockdown (shGli1) in the P1 cardiomyocytes. g qPCR analysis of Mycn transcripts using RNA isolated from P1 and P28 wild-type heart tissue (n = 3). h qPCR analysis of Mycn transcripts using RNA isolated from control, SAG, and CyA treated isolated neonatal cardiomyocytes (n = 3 replicates from each group). i Schematic of Mycn overexpression and knockdown experiments in the P1 cardiomyocytes. j, k Immunostaining (j) and quantification of α-Actinin+-EdU+ cells (k) from control, Mycn, and shMycn lentiviral infected neonatal cardiomyocytes. Quantification was performed from three biological replicates. l, m qPCR analysis of Ccnd2 and Cdkn1b (p27) in the cultured cardiomyocytes following Mycn overexpression and knockdown (shMycn) conditions (n = 3 for each group). n Schematic showing the Mycn genomic locus (top panel) harboring evolutionary conserved Gli1 binding motifs. o ChIP-PCR and quantification (p) for the Mycn promoter region following immunoprecipitation for endogenous Gli1 using isolated neonatal cardiomyocytes. q Schematic of combinatorial lentiviral infection studies using Gli1, shGli1, Mycn, and shMycn viral particles. r, s Immunostaining (r) and quantification of α-Actinin+-EdU+ cells (s) from control, Gli1, shGli1, Mycn, and shMycn (using Clone A; see Supplementary Fig. 8j) infected using isolated neonatal cardiomyocytes. Quantitative analysis represents counting of three random fields from three replicates (n = 1000 cardiomyocytes for each condition). Arrowheads indicate EdU+ labeled cardiomyocytes Data are presented as mean ± SEM (*p < 0.05; **p < 0.01; #represents significance (p < 0.05) between Gli1+shMycn compared Gli1 conditions; δrepresents significance (p < 0.05) between shGli1+Mycn compared to Mycn conditions) (see also Supplementary Fig. 8) and scale bars = 200 μm. Statistical tests were done using two-tailed unpaired Student’s t-test and one-way ANOVA

