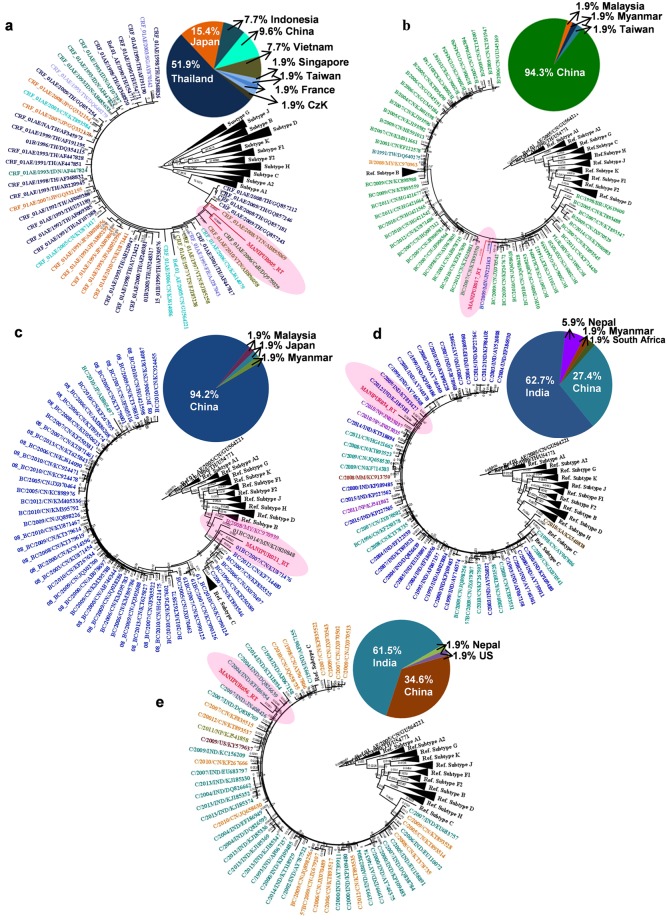
Figure 4.
TDRM RT sequences ML phylogenetic tree of HIV-1 Manipur sequences and 52 highly similar (nucleotide similarity >94%) sequences from other countries selected with Blastn analyses. Sample Manipur005_RT (a), sample Manipur017_RT (b), sample Manipur021_RT (c), sample Manipur034_RT (d) and sample Manipur056_RT (e). Manipur sequences are shown in highlighted red color. The tree was rooted using reference subtype sequences. The numbers along branches correspond to aLRT values. Bar is in nucleotide substitutions per site. The pie chart shows the proportion of countries represented by the Blastn analysis. Countries correspond with defined colors which are specified in each pie chart.

