Figure 2.
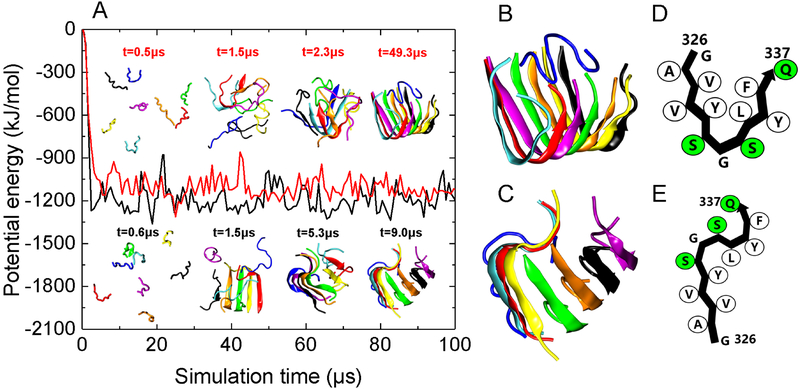
DMD/PRIME20 simulations of P1. (A) A plot of potential energy of P1 peptide aggregation versus simulation time. Also shown are simulation snapshots of eight random coil P1 peptides aggregating to form U-shaped (top panel corresponding to the red curve) and S-shaped (bottom panel corresponding to the black curve) P1 protofilaments. Each of the eight peptides has a distinct color. (B) and (C) are the final simulation snapshots of the S-shaped (B) and U-shaped (C) P1 protofilaments, respectively. (D) and (E) are the schematic representation of peptide conformation in the U-shaped and S-shaped P1 protofilaments. Hydrophobic and polar residues are shown in white and green, respectively.

