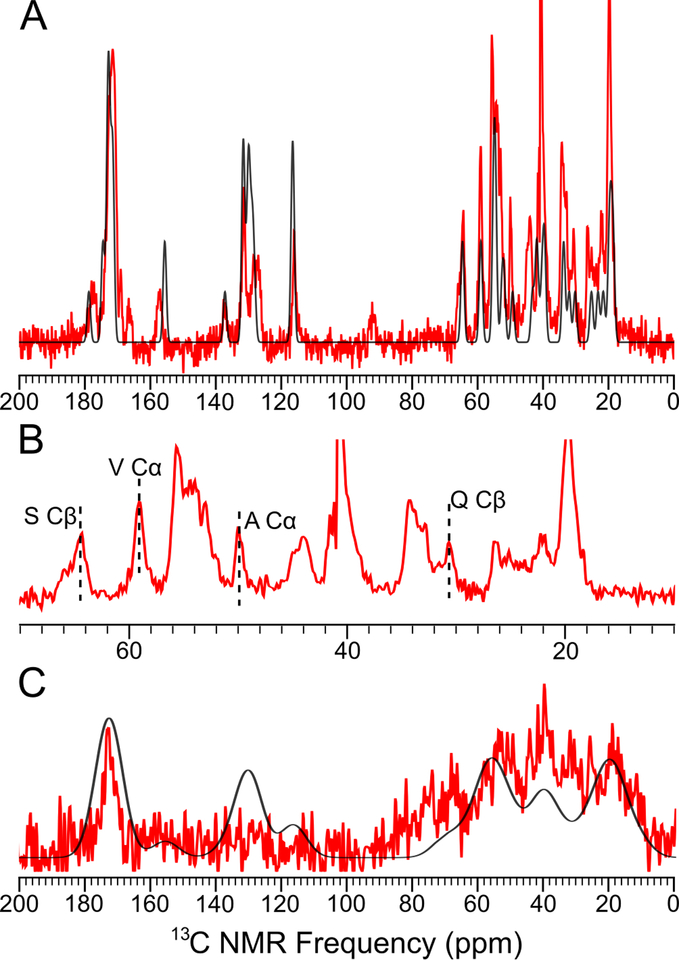
Figure 5.
1H-13C CPMAS 13C spectrum of P1 and P3 aggregates with no 13C enrichment. (A) The spectrum of P1 fibril (red) and the predicted spectrum (generated by summing all Gaussian peaks at the chemical shifts of all 13C in the peptides) with FWHM = 1.2 ppm (black). (B) The region of aliphatic carbons in Panel A. (C) The predicted CPMAS spectrum of P3 fibril (red) and the predicted spectrum with FWHM = 14 ppm (black).

