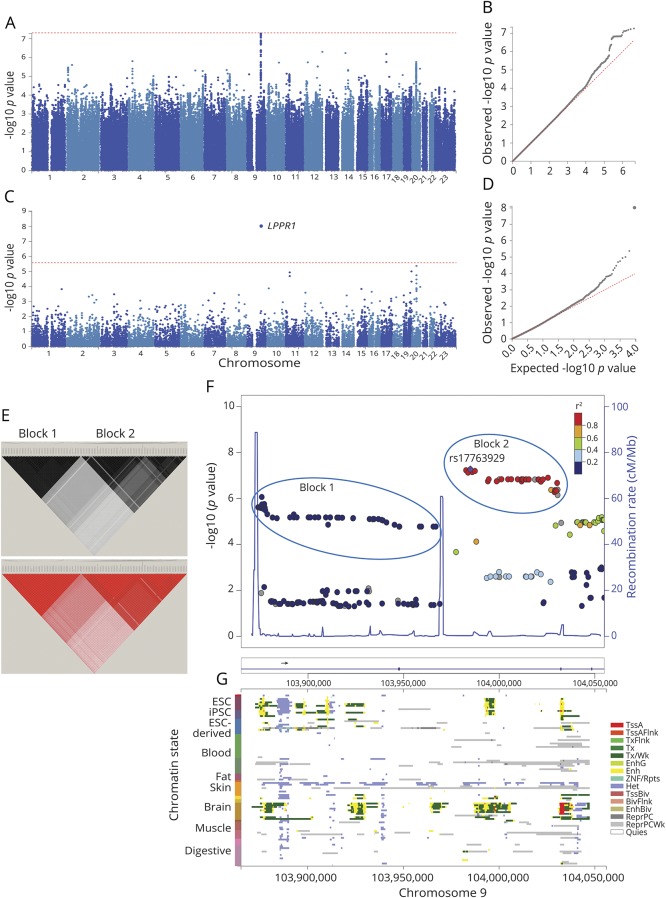
Figure 1. Results of genome-wide association study for age at diagnosis of PD.
Genome-wide association was tested between 8.5 million SNPs and age at diagnosis in 1,950 PD cases from the NGRC, using the Cox hazard ratio regression method and adjusting for principal components (PC1-3). (A) Manhattan plot of SNP-based GWAS. Tallest peak, at p = 5E-8, was on chromosome 9q31.1. (B) QQ plot of SNP-based GWAS. The observed p values were not inflated (λ = 1.007). (C) Manhattan plot of gene-based GWAS. LPPR1 was at p = 1E-8. Statistical significance threshold was p < 2.6E-6, which is Bonferroni corrected for the 18,985 protein-coding genes tested. (D) QQ plot of gene-based GWAS. The observed p values were not inflated (λ = 1.04). (E) r2 (top panel) and D' (bottom panel). Linkage disequilibrium (LD) across the SNPs that gave p < 1E-4 for association with age at diagnosis reveals 2 blocks represented by rs73656147 (left triangle) and rs17763929 (right triangle). (F) Magnified map of the associated region (chr9:103,865,000–104,055,000), showing that PD-associated SNPs map to LPPR1 and form 2 haplotype blocks separated by recombination hot spots (blue spikes). (G) Chromatin state of LPPR1 (Roadmap 111 Epigenomes), showing that active enhancers (yellow), transcription start site (red), and transcripts (green) of LPPR1 are seen only in stem cells and the brain and that the GWAS SNPs align with regulatory elements. ESC = embryonic stem cell; iPSC = induced pluripotent stem cell; TssA = active transcription start site (TSS); TssAFlnk = flanking active TSS; TxFlnk = transcription at gene 5′ and 3'; Tx = strong transcription; TxWk = weak transcription; EnhG = genic enhancers; Enh = enhancers; ZNF/Rpts = zinc-finger genes and repeats; Het = heterochromatin; TssBiv = bivalent/poised TSS; BivFlnk = flanking bivalent TSS/enhancer; EnhBiv = bivalent enhancer; ReprPC = repressed polycomb; ReprPCWk = weak repressed polyComb; Quies = quiescent.

