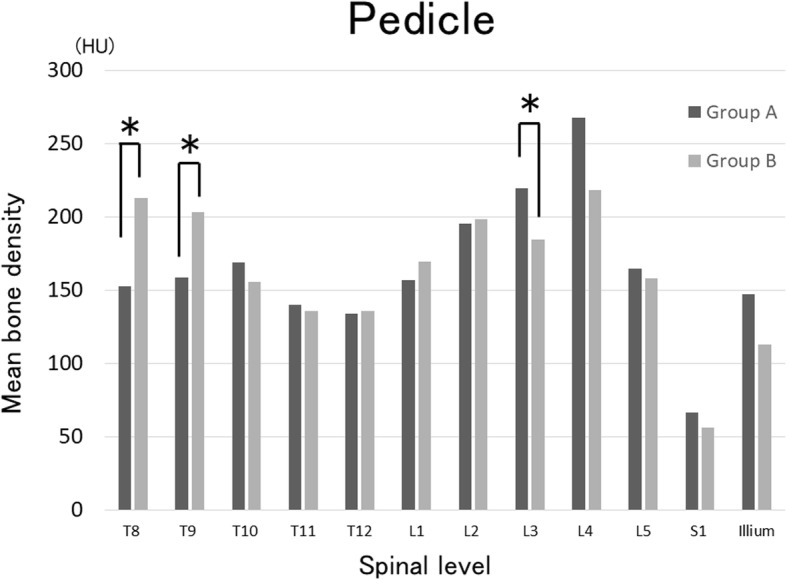
Fig. 3.

Evaluation of mean bone density of the pedicle on spinal CT. The mean bone densities of the T8 pedicle were 158 and 213 HU in group A and B, respectively (P = 0.03) and those of the T9 pedicle were 158 and 203 HU, respectively (P = 0.02), being significantly higher in group B. In contrast, those of the L3 pedicle were 219 and 184 HU, respectively, being significantly higher in group A (P = 0.04). *Significant difference between groups with P < 0.05
