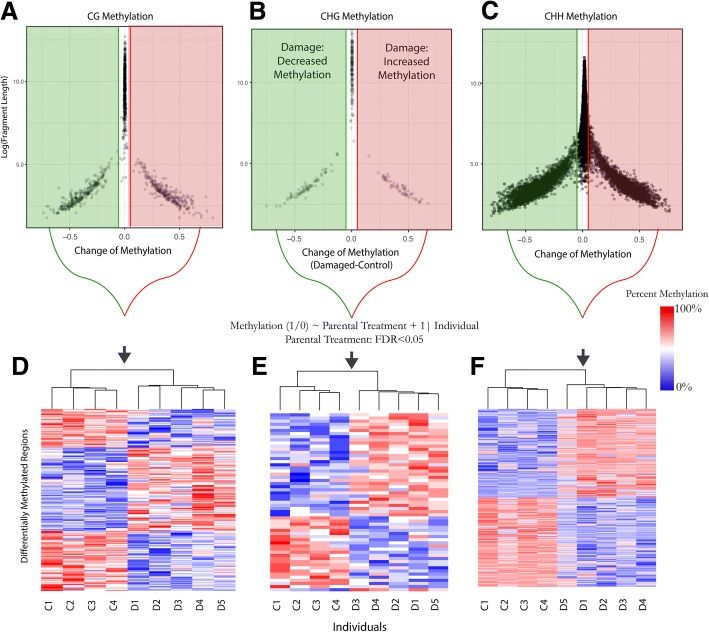
Fig. 3.
Differentially methylated genomic regions at CG, CHG, and CHH contexts based on PELT and GLM analyses. In the top panel (a-c) PELT-derived methylation difference (parental damage - control) are reported as a function of imputed size (log-transformed). For each context, there is a general pattern of larger regions with little change to methylation in response to parent damage (white), and smaller regions with either higher methylation levels in control samples (green) or higher methylation levels in progeny of damaged parents (red). d-f Regions of significant differential methylation across the three contexts (up or down, FDR<0.05 based on GLM approach) are shown in heatmaps with percent methylation standardized by regions

