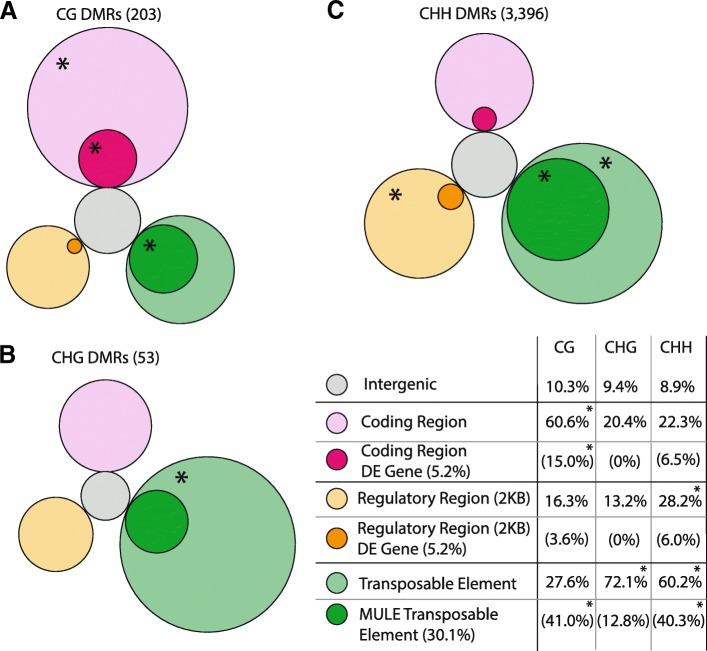
Fig. 5.
Circular diagrams showing the relative proportion of CG, CHG, and CHH DMRs across different genomic contexts. Intergenic regions are classified as those that do not fall into the other three categories, while three other categories (coding region, regulatory region, and transposable element) are depicted as the outer circles. Inner-circles represent subset of the DMRs within that group: (1) Magenta: DMRs that overlap coding regions that were found to be differentially expressed in Colicchio, 2015b (2) Orange: DMRs that are within 2kb up-stream or down-stream of genes that were previously found to be differentially expressed in Colicchio, 2015b (3) Dark green: DMRs that overlap the MULE class of transposable elements. Asterisks in outer circles depict genomic contexts for which DMRs of that sequence context are enriched relative to other sequence contexts. Asterisks in inner circles represent classes enriched relative to the genome-wide average. a CG DMRs, b CHG DMRs, c CHH DMRs

