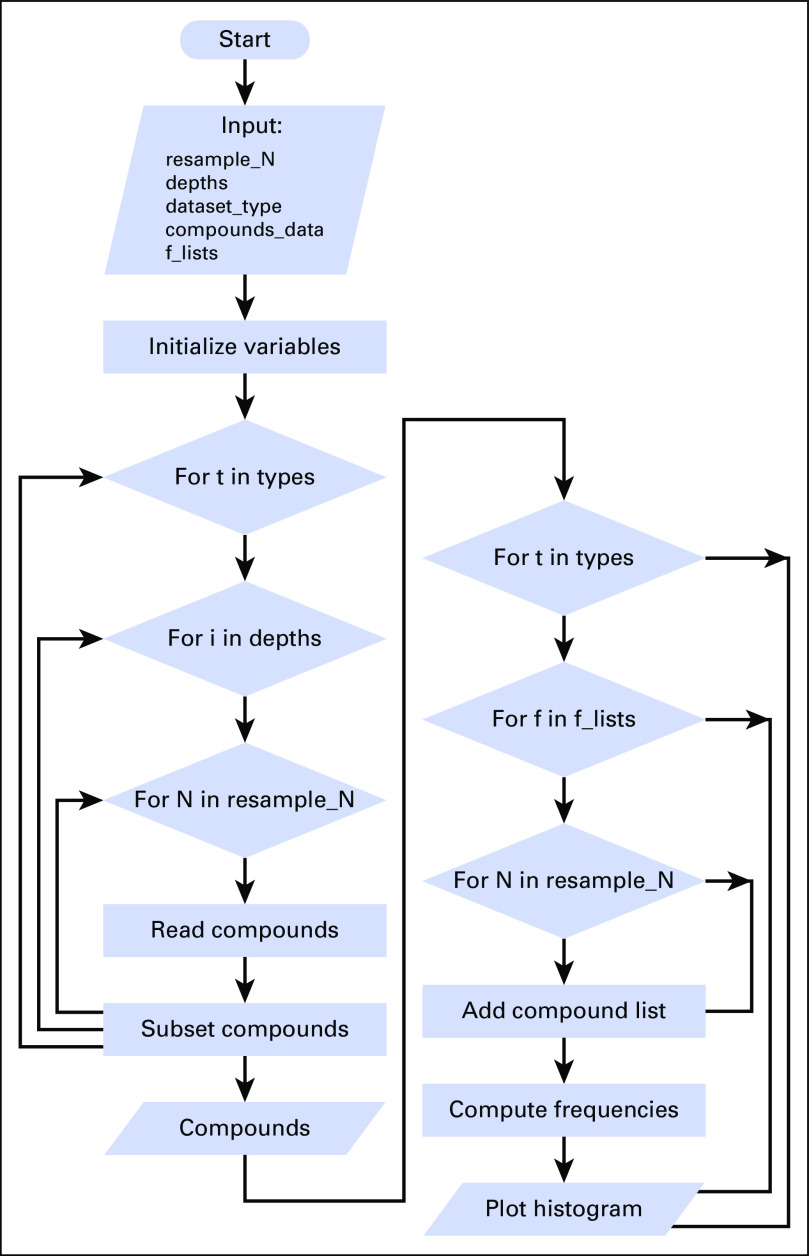
Fig A1.
Schematic depicting the bioinformatics pipeline implemented for the subsampling iterative analysis of connectivity mapping for target compound identification. Subsampling using 17 different data fractions (f = 0.01 to 1.0) and 25 iterations per data fraction providing 425 data sets with variable sequencing depth per gene signature. Count vectors were analyzed to detect differentially expressed genes (DEGs) and saved as gene lists. Gene lists were subsequently analyzed in connectivity mapping for target compound identification. RNA-seq analysis measured DEG, gene ontology (GO) terms, and target compound identification for the low- to high- (Dataset_I) and the high- to high-grade (Dataset_II) astrocytoma gene signatures.

