Figure 2.

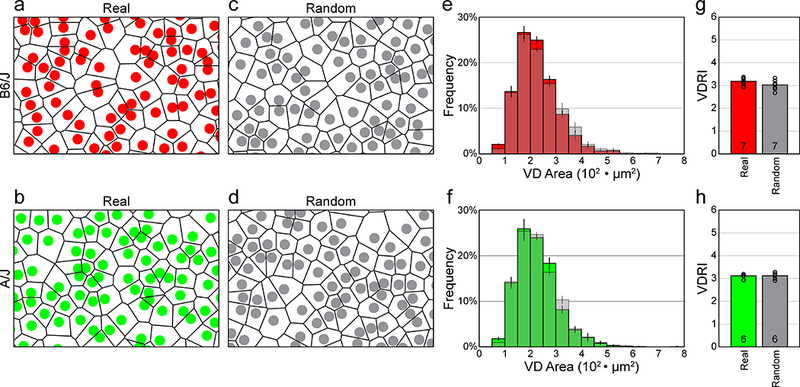
a, b: Spatial point patterns of AII amacrine cells from B6/J (red) and A/J (green) mouse retinas, showing the VD for each individual cell. The fields illustrated were cropped from the larger original sampled fields, showing somata scaled with respect to the field size (and hence Voronoi area). c, d: Comparable spatial point patterns from random simulations matched in density and soma-size to the real distributions shown above. The Voronoi tiling looks comparable to the real mosaics. Cell sizes in a-d are shown as uniformly 7.5 μm in diameter, whereas in reality, as in the density-matched and soma size-constrained random simulations, they vary slightly, having a standard error of 0.5 μm. e, f: Frequency distributions (mean ± SEM) for the VD areas derived from the sampled retinas and their matched random simulations (shaded), for both strains. g, h: Histograms showing the mean VDRIs for the real versus random distributions, for both strains. The average VDRI for each retina is indicated with an open circle. Note that the regularity indexes for the real versus random distributions are nearly identical, for both strains.
