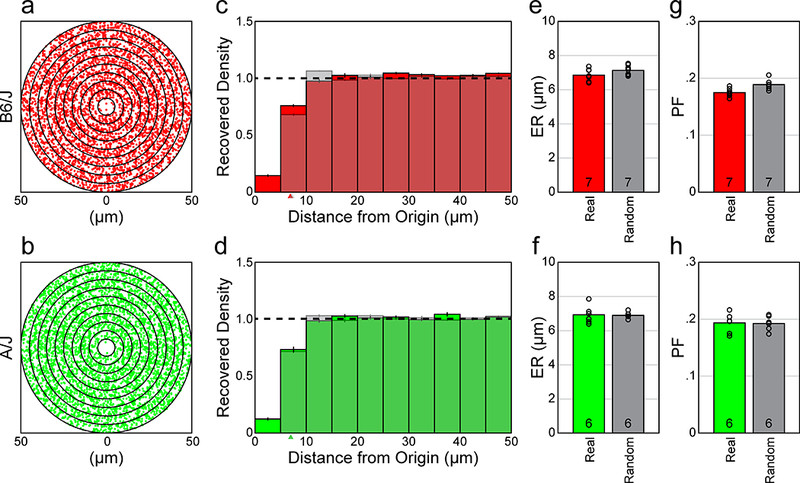
Figure 3.

a, b: Spatial ACs for the two sampled fields from B6/J (red) and A/J (green) mouse retinas shown in figure 2a, b. Each dot in the AC indicates the positioning of the centroid of the cell with respect to the origin, dot size now being substantially smaller than soma size to permit better resolution between cells. Successive annuli from the origin are at 5 μm intervals. c, d: DRPs derived from the ACs of the sampled retinas and their density-matched and soma size-constrained random simulations (shaded), for both strains. Each bin indicates the average spatial density at increasing annuli in the ACs, while the horizontal dashed line indicates the expected density of each bin for a theoretical random distribution with no constraints (normalized for each field). Both the real and the soma-size constrained random distributions show a vacant region at the origin, the “exclusion zone”, appearing comparable in size. Arrowheads indicate the ER in each DRP; these cannot be discriminated between the real and random distributions in the A/J strain. e, f: Histograms showing the mean ERs for the real versus random distributions, by retina, for both strains. The ER is an index of the size of the exclusion zone revealed in the DRP. g, h: Histogram showing the mean PF for the real versus random distributions. Note that the PF is nearly identical between the real versus random distributions, for both strains, as should be expected given their comparable ERs. Open circles indicate individual retinal averages for both the ER and PF statistics.
